BNB flips SOL in market cap – Here’s how ‘memecoin mania’ was key
Assessing the odds of SOL reclaiming the fifth largest position from BNB.

- BNB flipped SOL on the rankings charts, thanks to a tweak in emerging memecoin trends
- However, SOL/BNB remains at a pivotal point and SOL can still regain lost ground on the charts
Binance Coin [BNB] is in the news today after it reclaimed the fifth-largest cryptocurrency position on the rankings charts, flipping Solana while doing so. According to CrytoQuant, the shift was driven by memecoin mania, which moved from Solana to BNB Chain.
“BNB flipped SOL. Memecoin momentum has shifted to BNB Chain, pushing its market cap back into the top five at $91B. SOL now trails at $73B.”
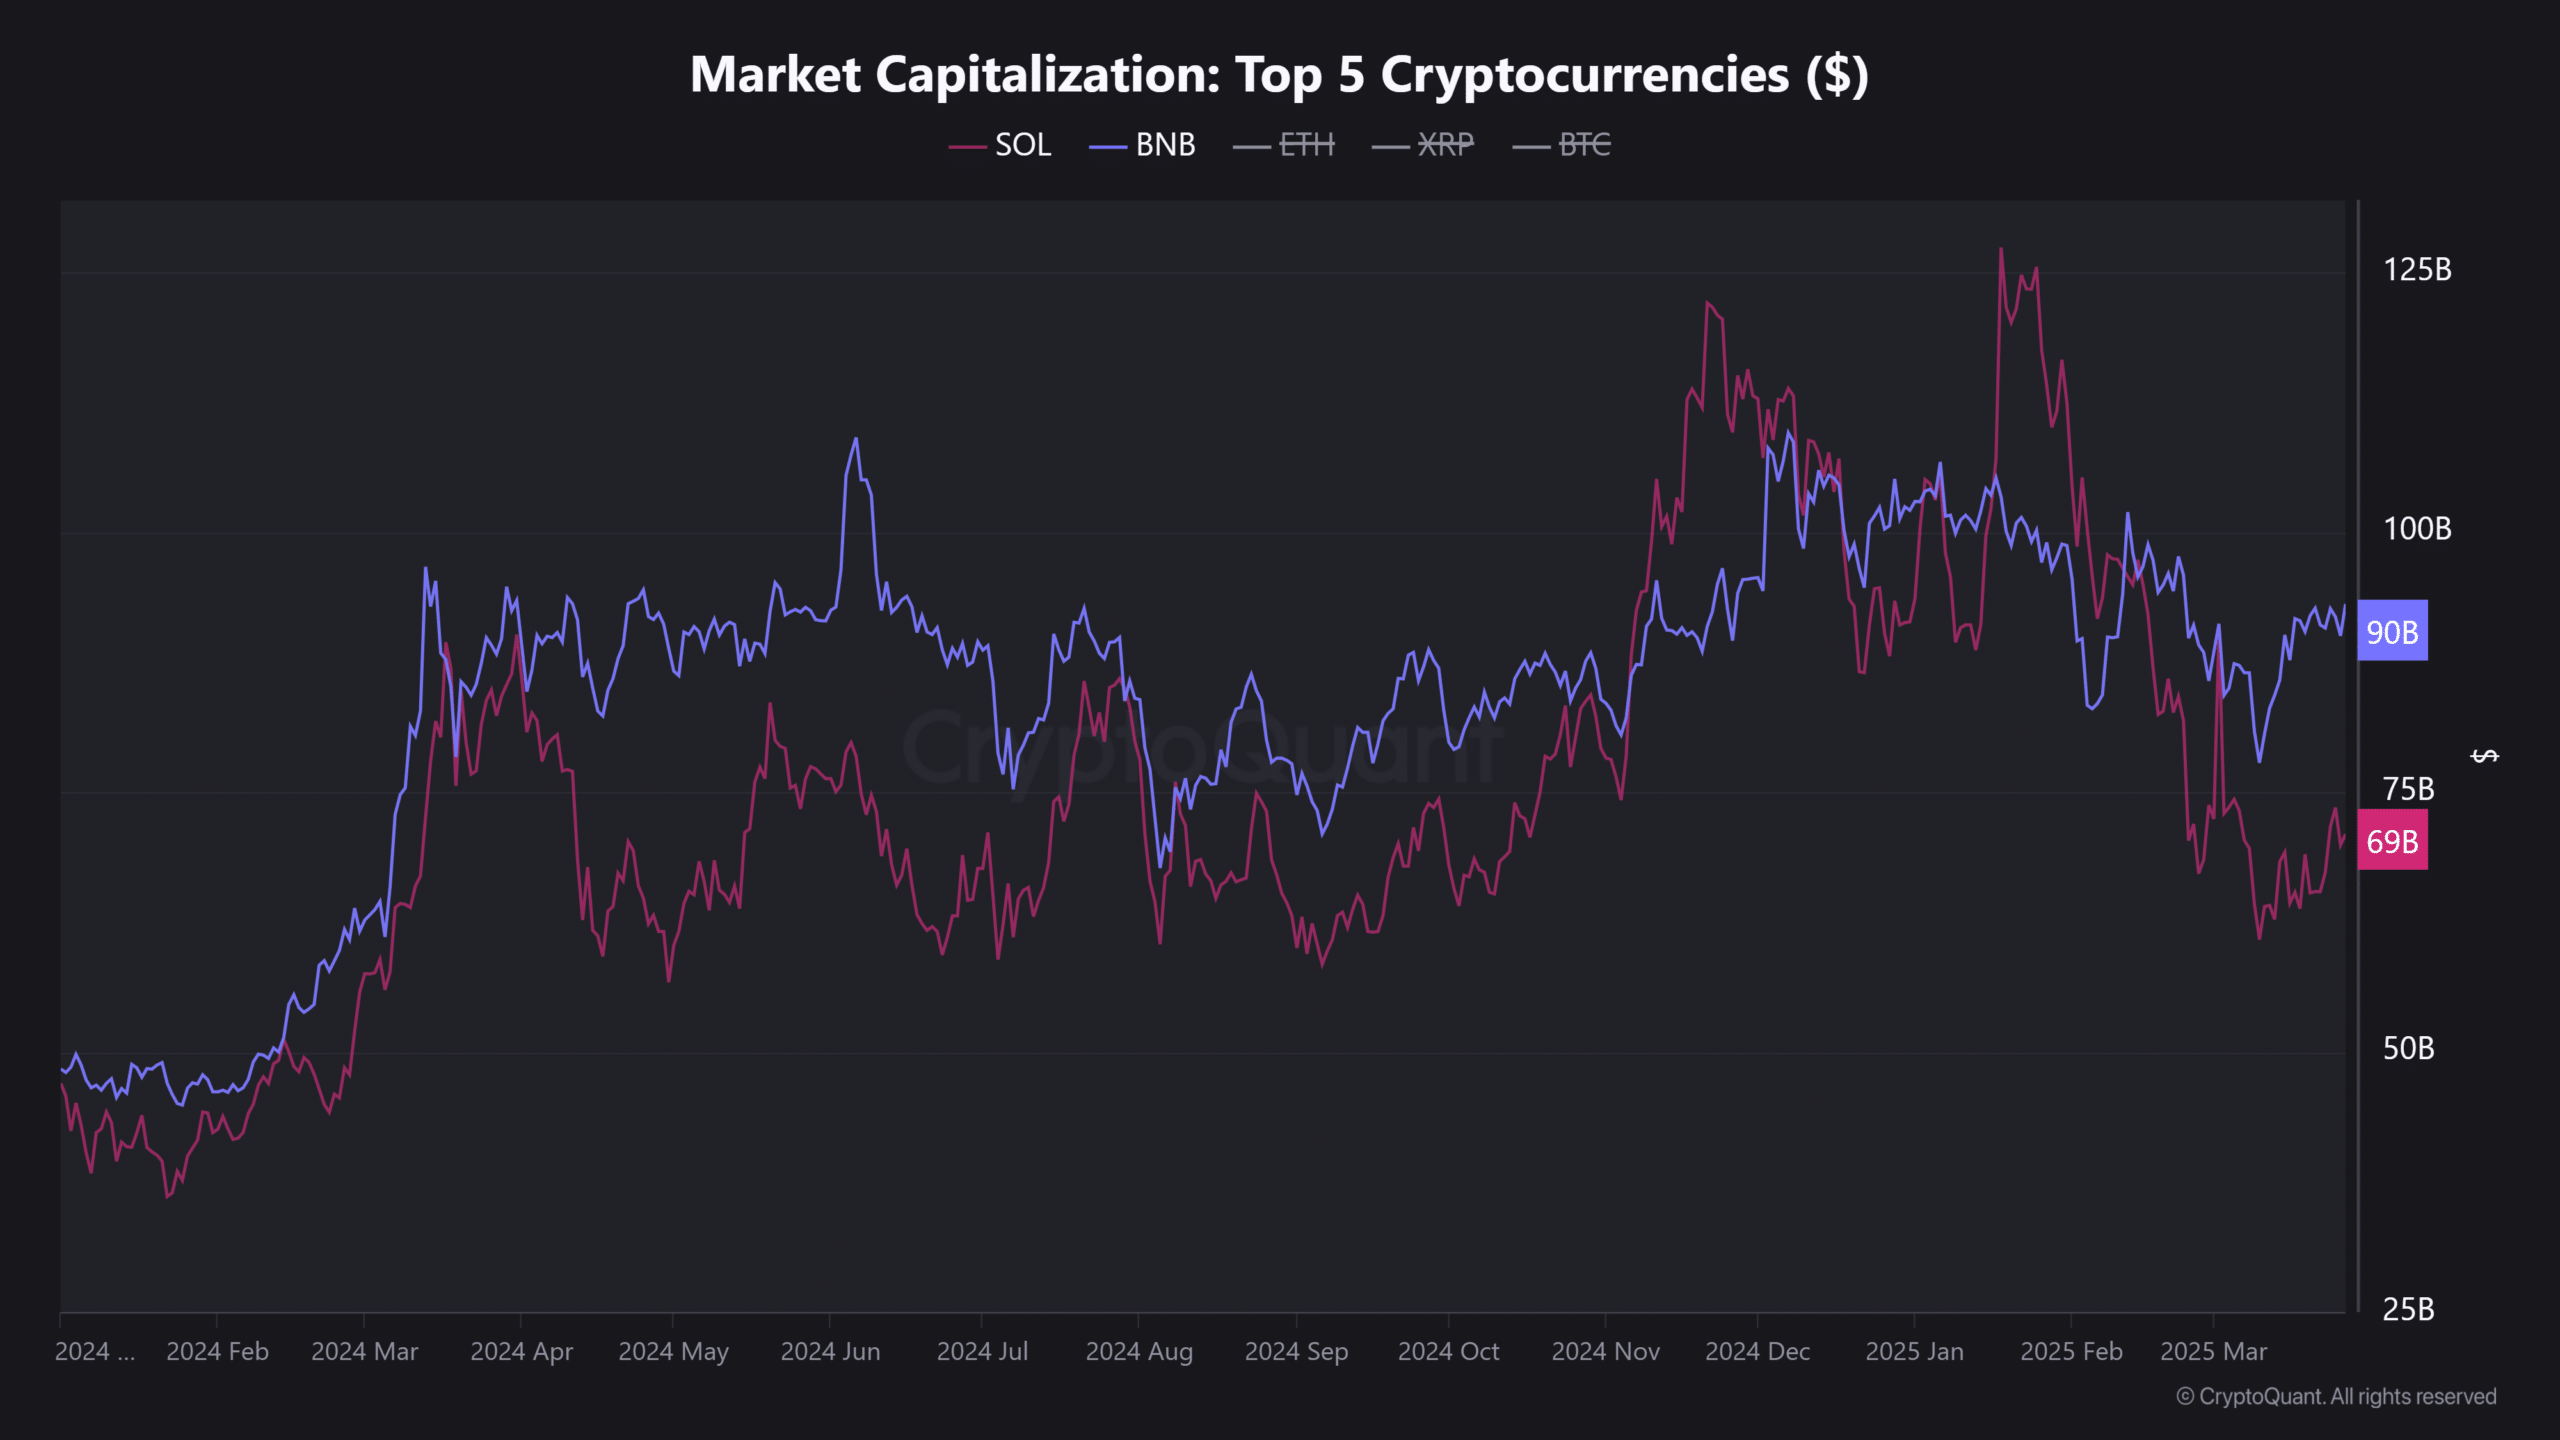
Based on the market cap traction, the shift happened in mid-February, right after the LIBRA memecoin saga and market manipulation revelations.
As a result, memecoin traction dropped significantly on Solana. In fact, its DEX volumes later tanked by 60%, with notable declines across Pump.fun and Raydium ecosystems.
SOL vs BNB traction
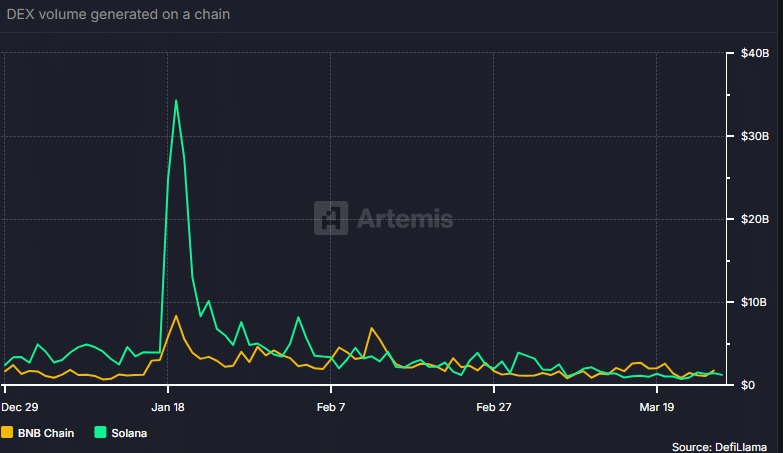
The changes in DEX (decentralized exchanges) trading volumes also captured the shift. Over the past three months, Solana’s DEX volumes have fallen from a record high of $30 billion to $1.4 billion – A 95% decline.
According to Artemis data, this was a drop in DEX volumes of around 50% on a 3-month adjusted basis, compared to BNB Chain’s slight pump of 4%.
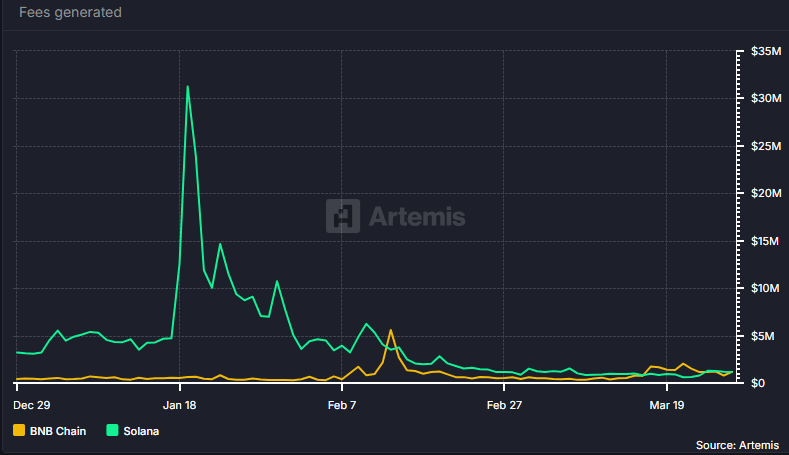
Simply put, right now, there is relatively more speculative interest in the BNB chain, than in Solana. Interestingly, this also allowed the BNB chain to collect more fees than Solana over the same period.
According to Artemis, fees for the BNB chain averaged $1.17M over the past three months – A 171% surge. On the contrary, for Solana, the fees were down 63% and averaged $1.16M. Put differently, the BNB Chain has enjoyed more traction in late Q1 of 2025
However, Solana still has a higher daily active address count (around 4M), compared to BNB Chain’s 1.6 M. As such, Solana could reclaim its spot as ‘home of memecoins’ if the broader market sentiment improves.
From an investors’ returns perspective, BNB holders are now better off than their SOL counterparts. In 2025, the SOL/BNB ratio dropped by over 50% on the charts.
This ratio tracks SOL’s relative price performance to BNB. A decline would mean SOL underperformed BNB, while a rally would suggest the opposite.
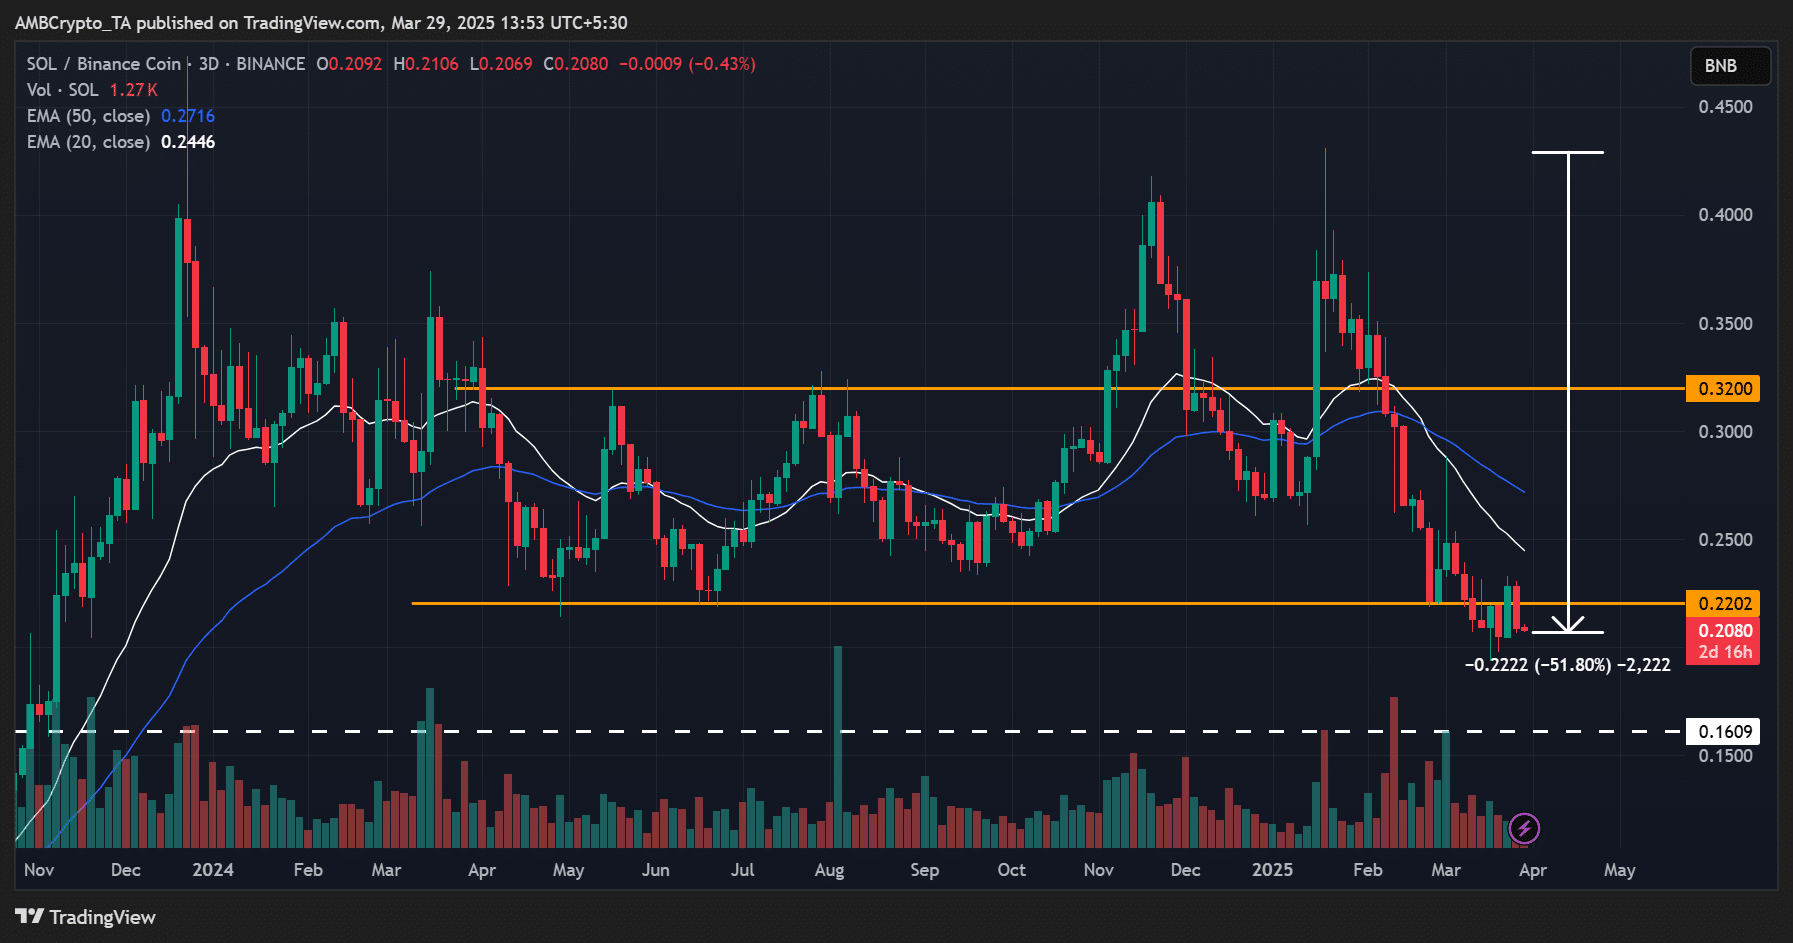
The 50% decline meant that SOL holders lost almost half their capital value, compared to BNB holders.
Worth noting, however, that the SOL/BNB ratio is at the range-low of a multi-month channel right now. Hence, a rebound and SOL potentially regaining ground against BNB cannot be overruled just yet.