
- BNB trades within a narrow range as traders stay their hands.
- Its price can break out in either direction depending on market sentiment.
Binance Coin [BNB] has traded near its 20-day Exponential Moving Average (EMA) and 50-day Simple Moving Average (SMA) in the past few days, signaling a period of market consolidation.
An asset’s 20-day EMA is a short-term moving average that reacts quickly to price changes. It reflects the average closing price of an asset over the past 20 days.
The 50-day SMA, on the other hand, is a longer-term moving average that reflects an asset’s average closing price over the past 50 days.
When an asset’s price trades close to these averages, it suggests that neither the buyers nor sellers are dominating the market. It indicates that the asset’s price is not convincingly trading in either direction but instead moving within a narrow range.
BNB moves within a tight range
AMBCrypto’s assessment of other technical indicators, including BNB’s Bollinger Bands, confirmed BNB’s narrow price movements.
This indicator tracks market volatility and periods of consolidation. When the gap between this indicator’s upper and lower bands contracts, with an asset’s price in the middle, the market is in the consolidation phase.
BNB’s price movements observed on a 1-day chart showed that the altcoin has been set up this way since 4 April.
Likewise, the coin’s Average True Range (ATR) has declined steadily since the beginning of May. This indicator measures an asset’s average volatility over a specified period. When it declines in this manner, an asset’s price is said to be in consolidation. At press time, the value of BNB’s ATR was 25.3. It has declined by 14% since 1 May.
Further, BNB’s Relative Strength Index (RSI) has moved sideways since the beginning of the month. A “flat” RSI such as this often implies a lack of strong buying or selling pressure in the market.
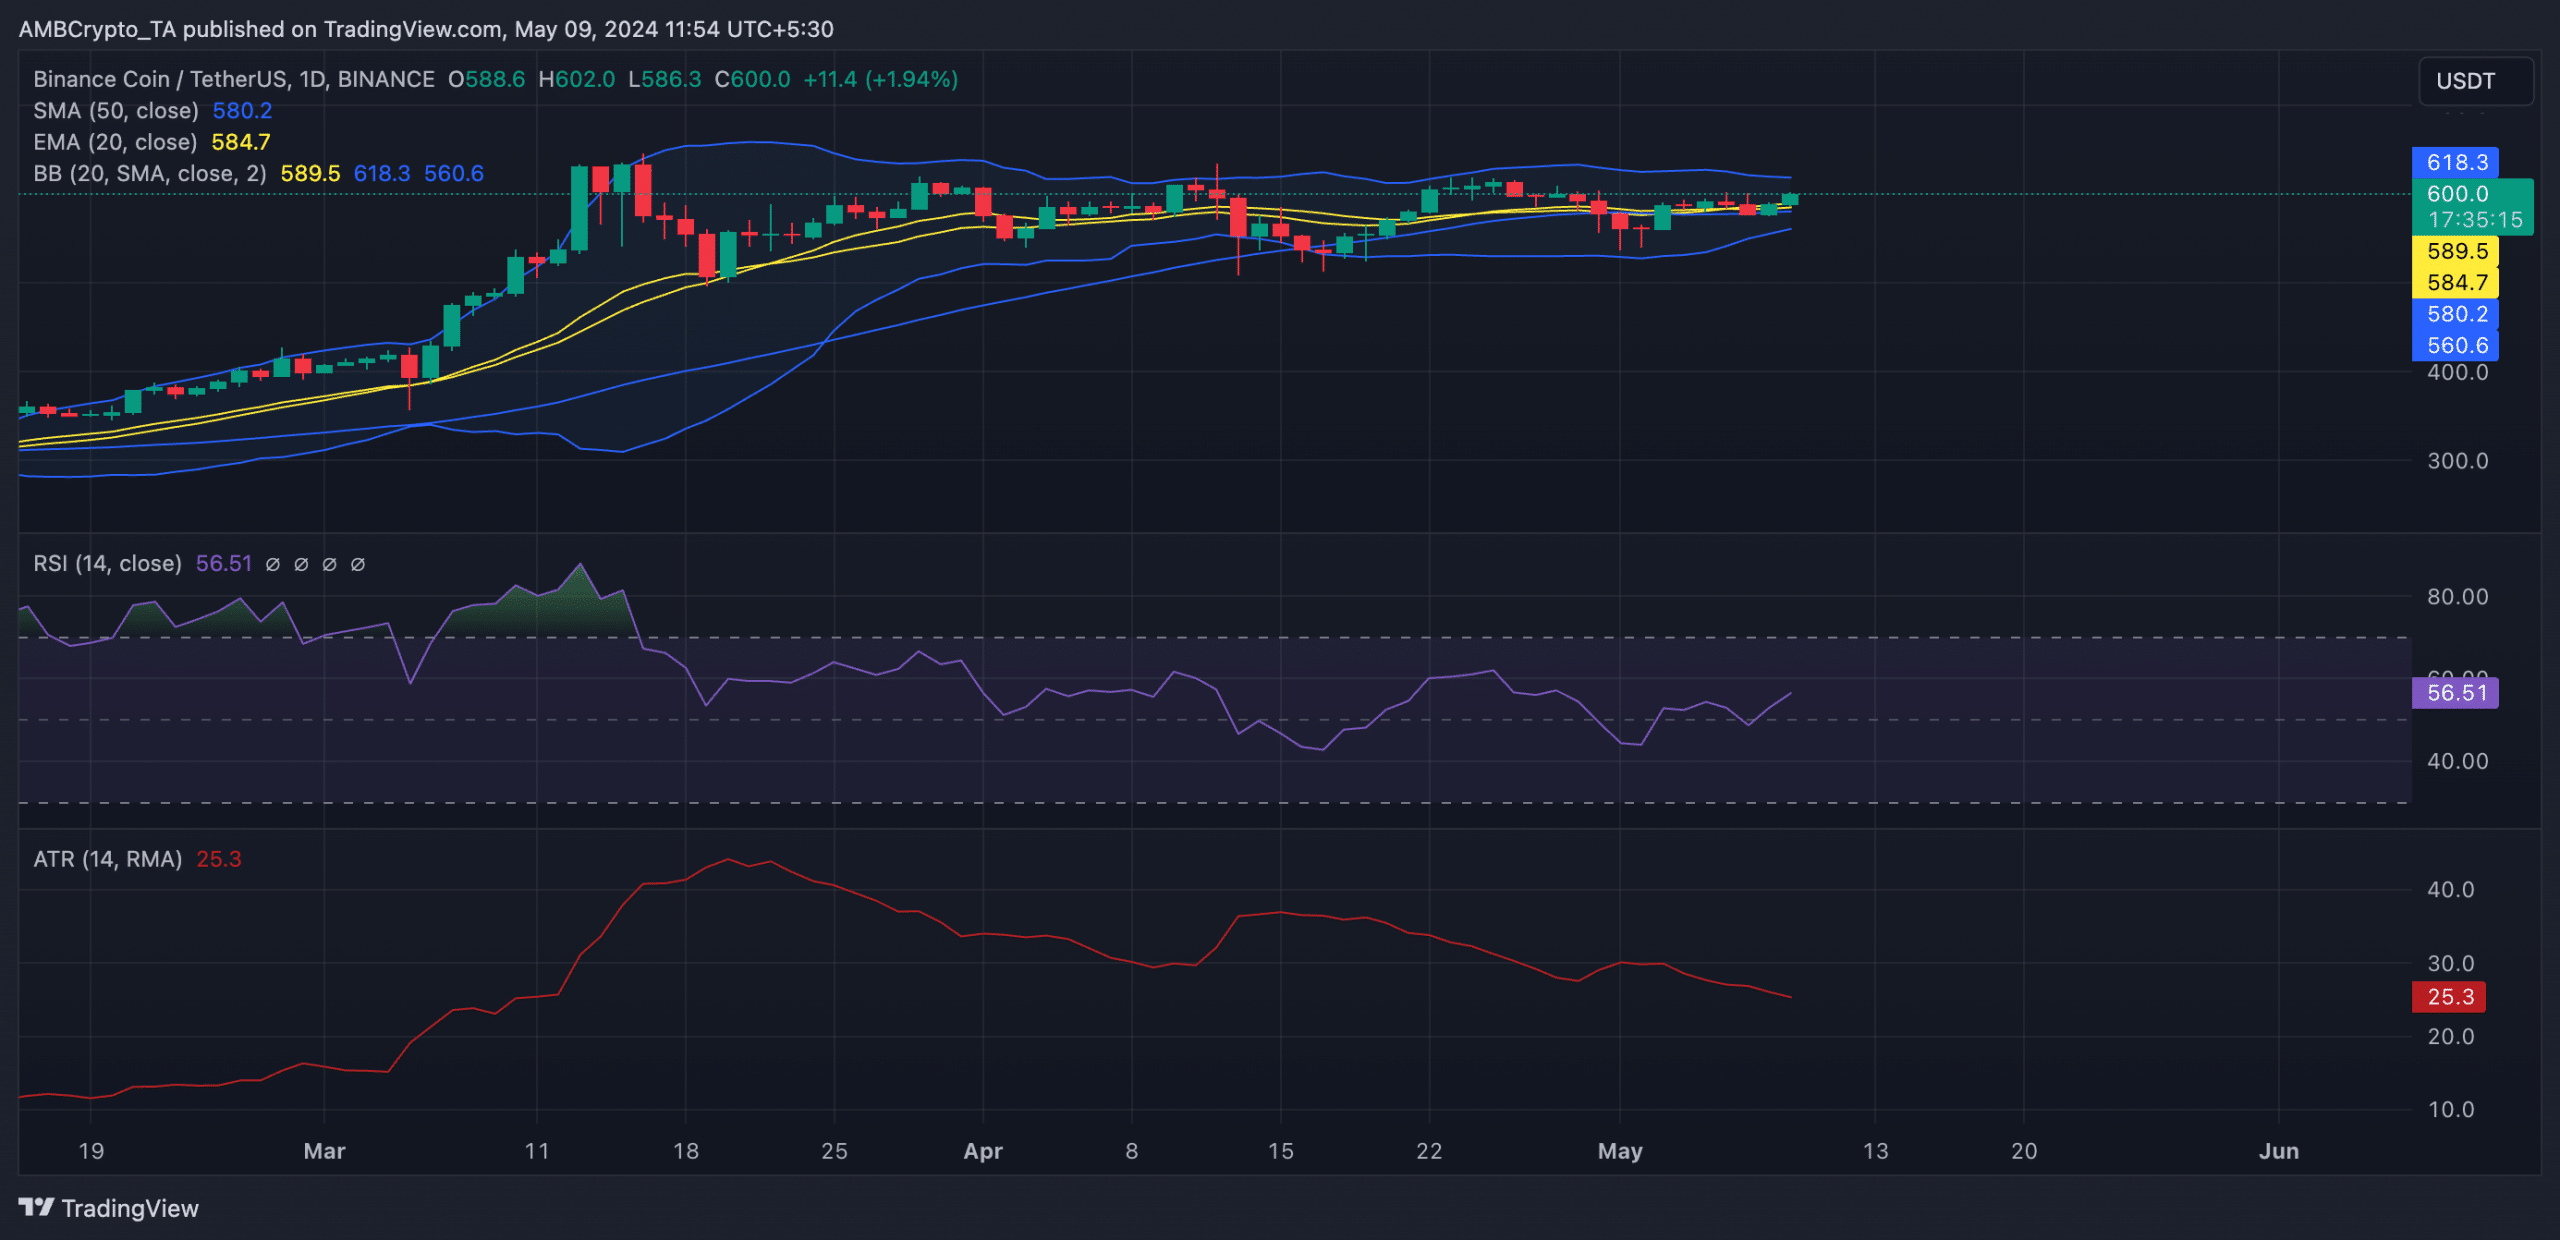
Source: BNB/USDT on TradingView
Is your portfolio green? Check the BNB Profit Calculator
What next for BNB?
If bullish momentum climbs and BNB breaks out of the narrow range in an uptrend, the coin may rally to exchange hands at $618.
However, if positive sentiment nosedives and bearish activity become significant, the altcoin may break support to trade below $556.
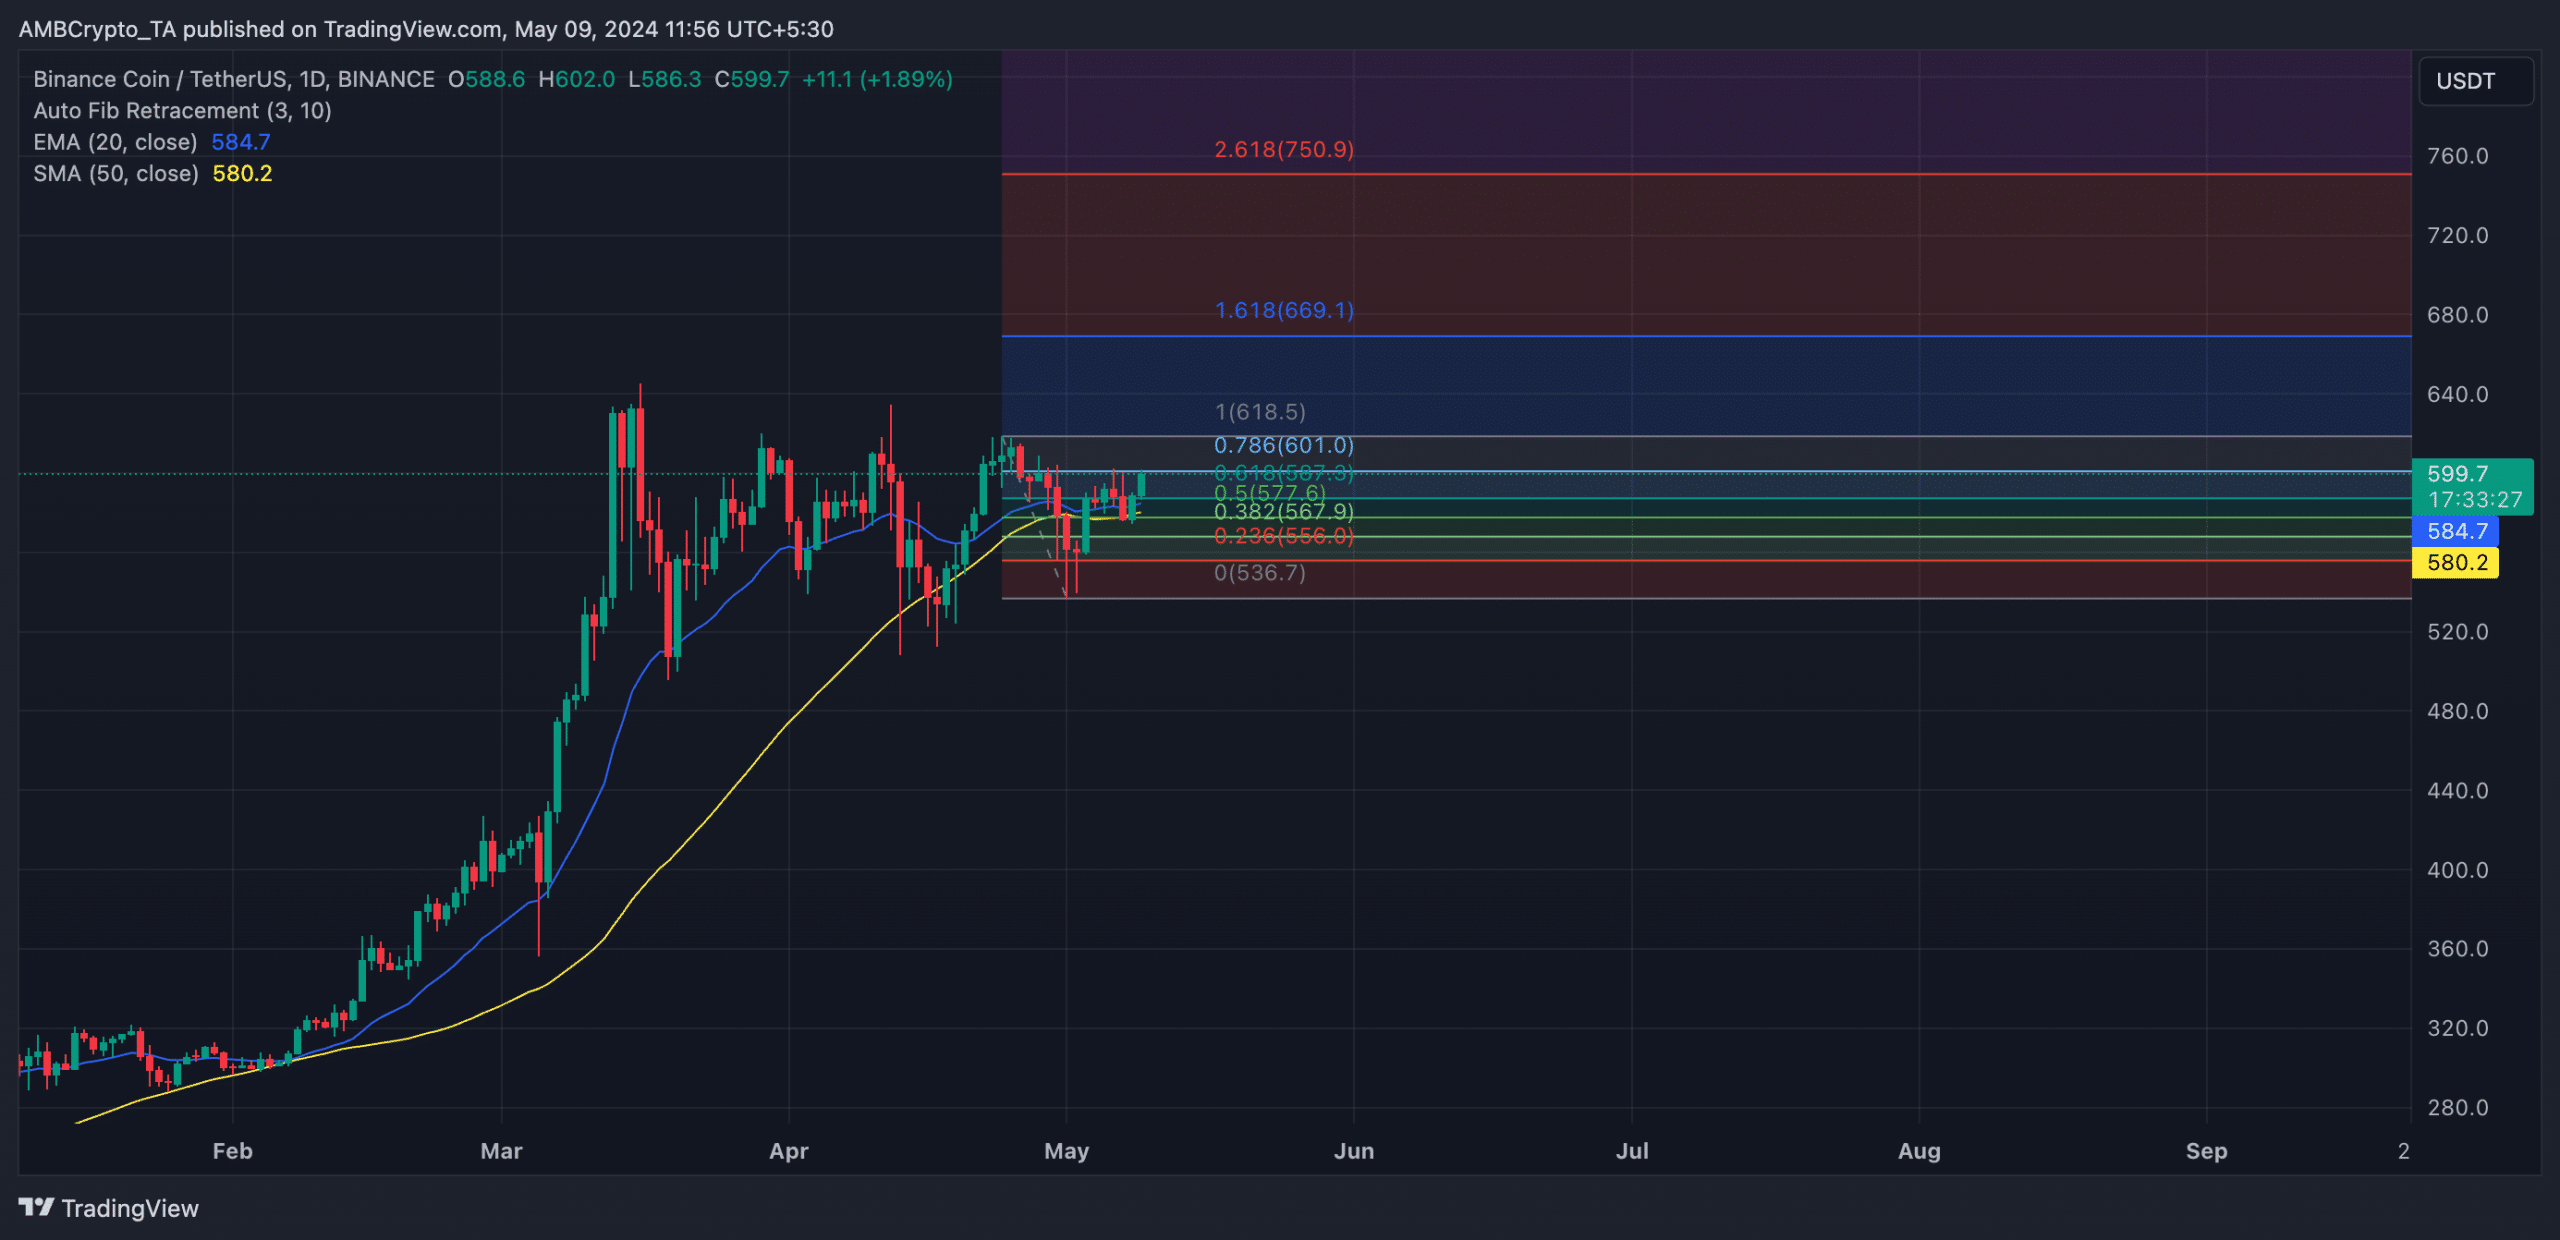
Source: BNB/USDT on TradingView