
- BNB jumped by more than 5%, but technical indicators were hinting at a possible bearish divergence.
- Transaction volumes on the BNB Chain have plunged by more than 33% in the last week, showing declining network activity.
Binance Coin [BNB] was the top gainer among the ten largest cryptos by market cap, after surging by more than 5% in the last 24 hours.
BNB was trading at $533 at the time of writing, a significant jump from the 24-hour low of $503. Despite these gains, BNB risked a bearish reversal if the bullish trend across the broader market failed to hold.
Will BNB’s bullish momentum hold?
The price of BNB has been mirroring that of Bitcoin [BTC]. Therefore, the likelihood of this token sustaining gains depends on whether the broader market maintains the positive sentiment.
BNB’s daily chart showed a possible bearish divergence. While the price was gaining, technical indicators hinted that the uptrend remained weak after BNB formed a double-top pattern on the daily chart.
BNB formed the first peak in late July after the price jumped from below $500 to test a key resistance at $600. A downtrend later followed to form a neckline at $464.
The uptrend resumed before failing again after hitting $600.
BNB will confirm a bearish breakout if it falls below $464. However, this bearish thesis will be invalidated if the current uptrend is sustained and BNB breaks resistance above the second peak.
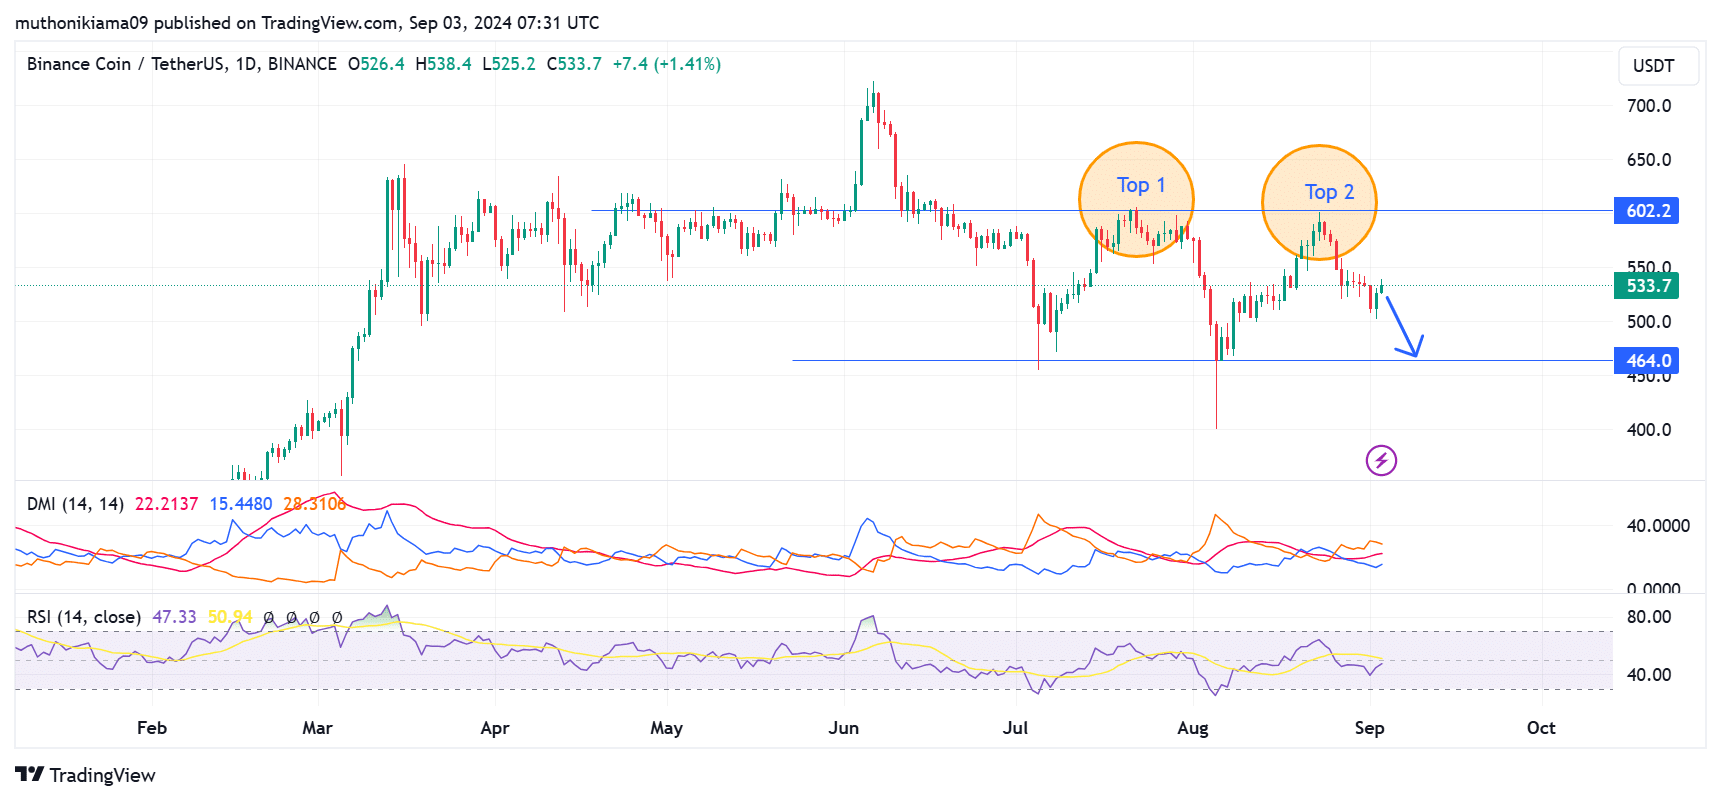
Source: TradingView
The Relative Strength Index at 47 showed that despite the gains, sellers remained in control. The RSI line needed to cross above the signal line to confirm the bullish momentum and invalidate the double-top pattern.
Another key indicator that showed a weakening uptrend was the Directional Movement Index (DMI). The positive DI (blue) remained below the negative DI (orange), which showed a potential bearish reversal.
Data from Hyblock Capital showed a high concentration of liquidations at $548. Therefore, this level could be a strong resistance point if traders buying into the rally take profits once BNB approaches $548 to manage losses.
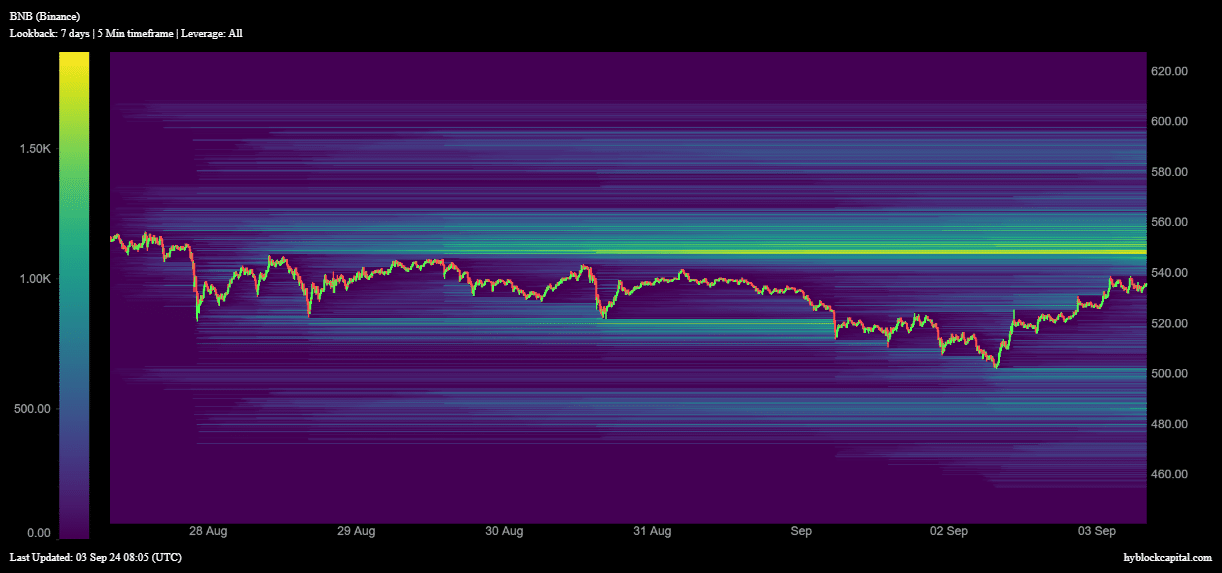
Source: Hyblock Capital
BNB Chain sees declining usage
The BNB Chain has also seen reduced usage, which could further hamper BNB’s ability to rally.
Data from DappRadar showed that in the last seven days, the number of unique active wallets on the network has dropped by 25%. Volumes have also fallen by more than 30% from around $850M to $350M.
Read Binance Coin’s [BNB] Price Prediction 2024–2025
This declining network usage could show reduced market interest in BNB.
Data from Coinglass showed that BNB’s Funding Rates have been predominantly negative over the past month, showing a general bearish sentiment among traders.
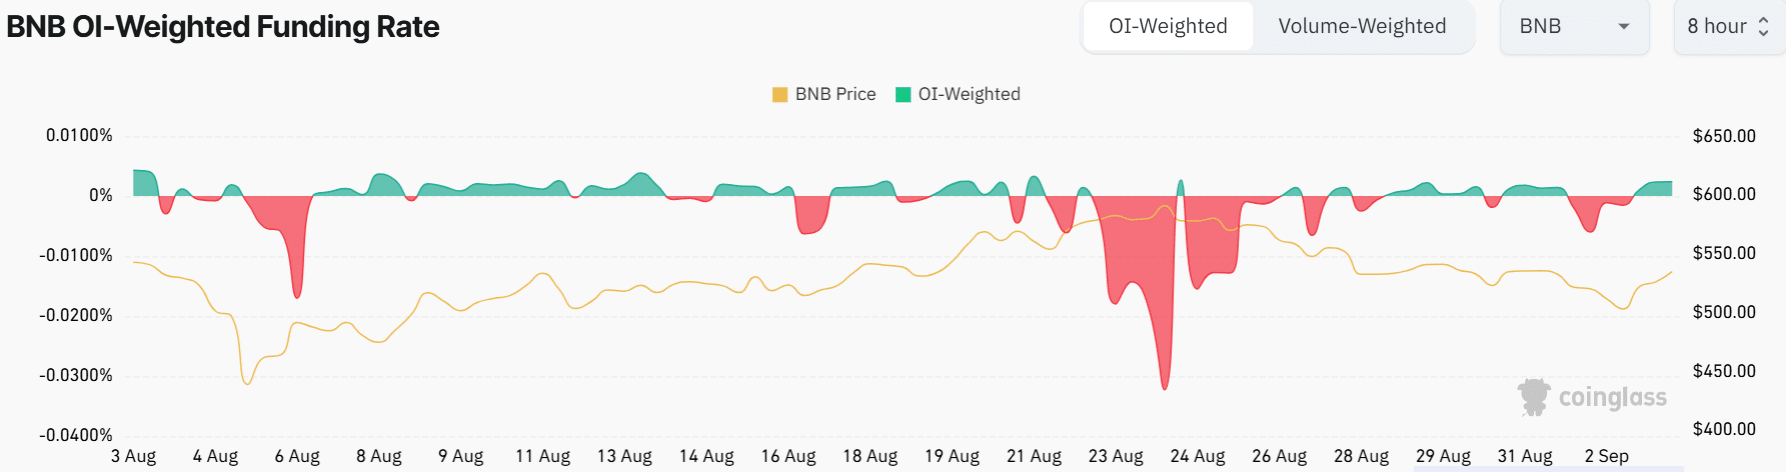
Source: Coinglass