
- BNB was rangebound, for now.
- A move beneath the range was favored, but a breakdown was not yet confirmed.
Binance Coin [BNB] traded within a range since the 19th of March. This range extended from $505 to $630, and BNB was on its way to retest the lows once more.
Over the past week, the exchange token has not shed as much value as most of the other large caps. While this was encouraging for investors, there was more to it than just relative strength.
The combination of buy walls and range lows
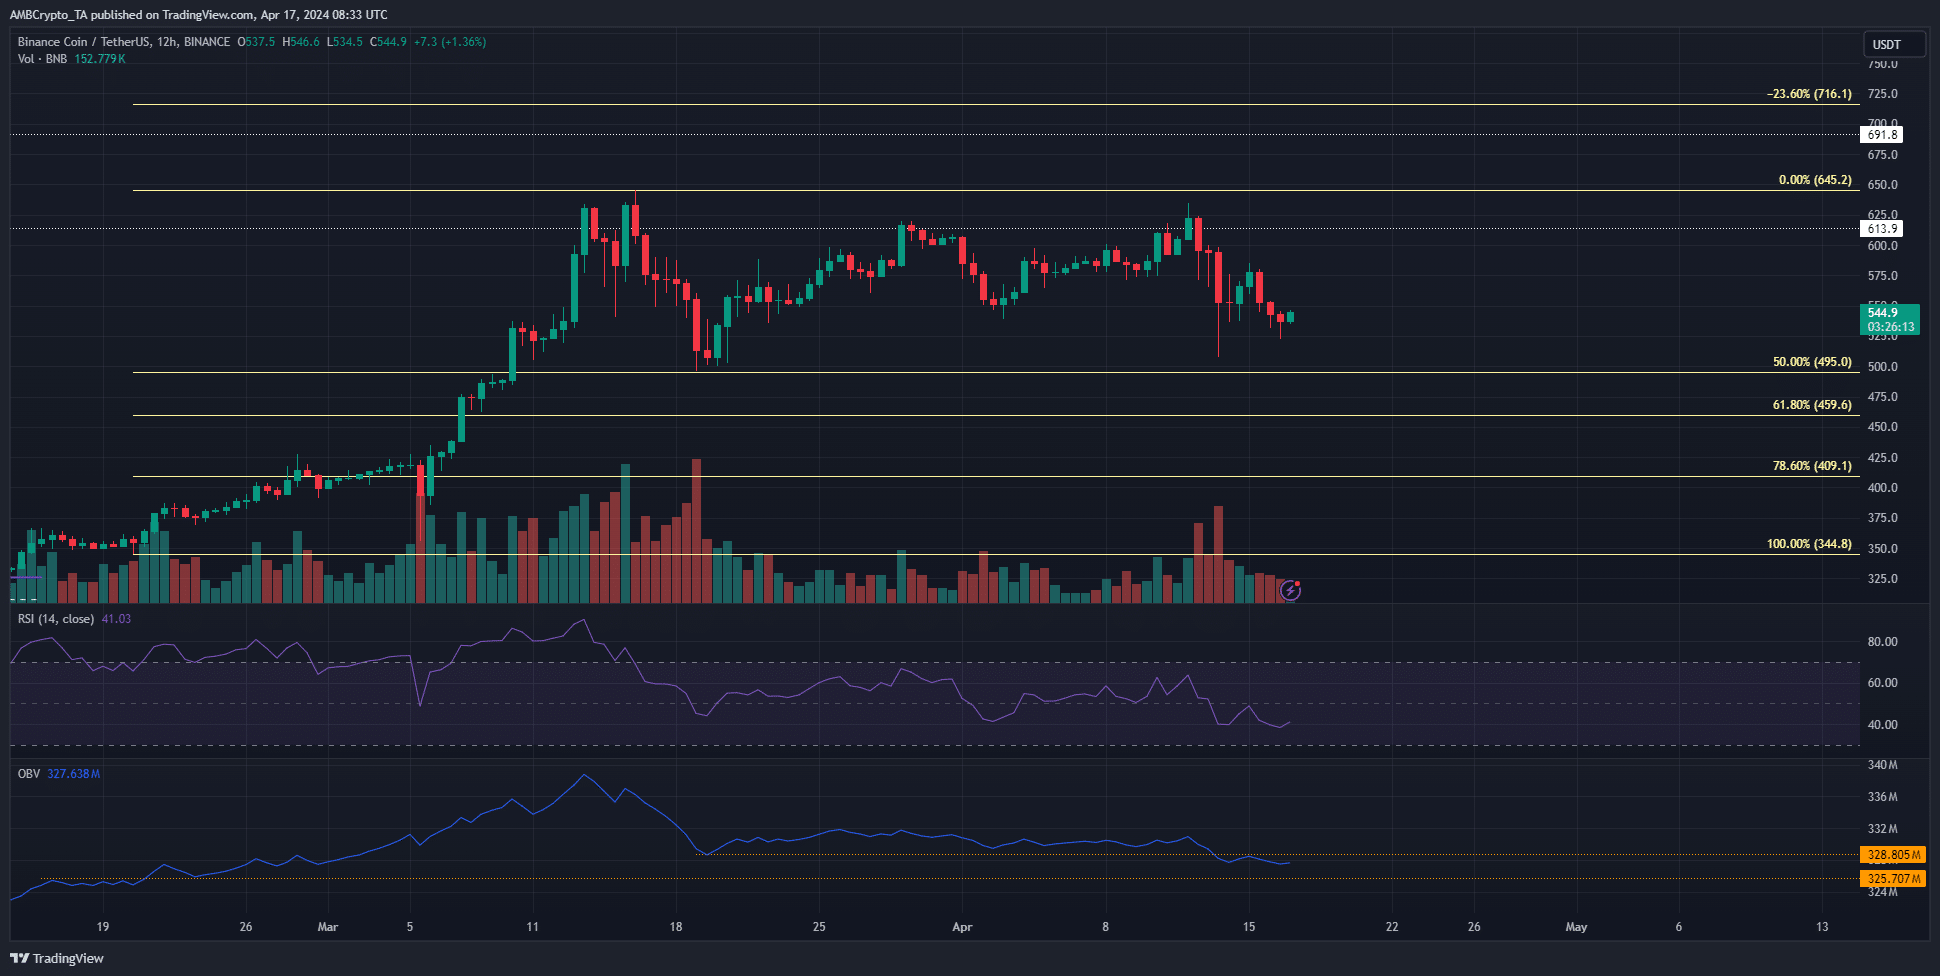
Source: BNB/USDT on TradingView
The trading volume has been relatively muted over the past month. It surged on the 12th and 13th of April as selling pressure intensified. This wave saw the OBV fall below a month-long support.
This drop also indicated added impetus to the bears. It highlighted the possibility that seller dominance might push prices below the $505 range low, and beneath the 50% Fibonacci retracement level at $495 as well.
The RSI was also below neutral 50 to underline downward momentum.
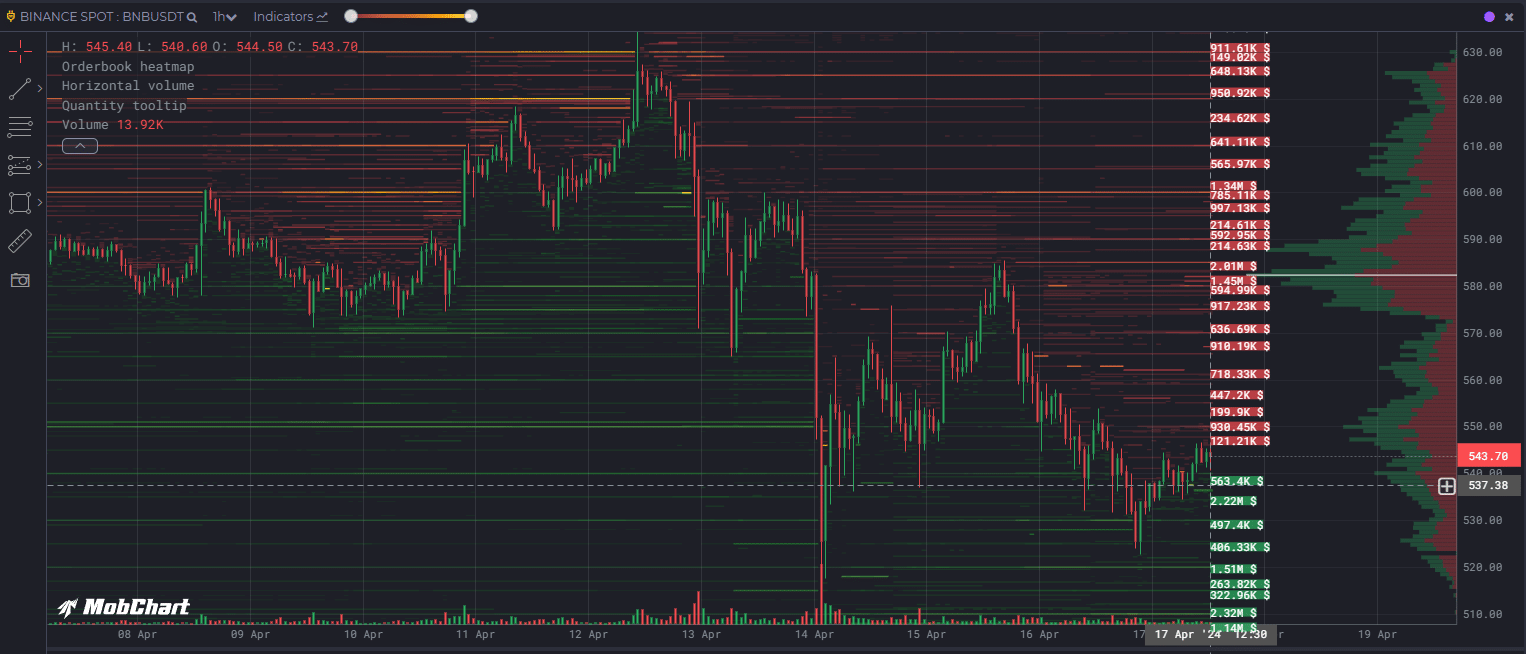
Source: MobChart
The order book data showed that limit buy orders worth $1.51 million and $2.32 million at $520 and $510 respectively.
Their confluence with the range low and the bearish pressure suggested that these buy walls will be tested shortly.
To the north, the $580 and $585 levels had a similar amount of limit buy orders, marking it as a resistance zone.
The presence of short-term demand could undermine BNB bears
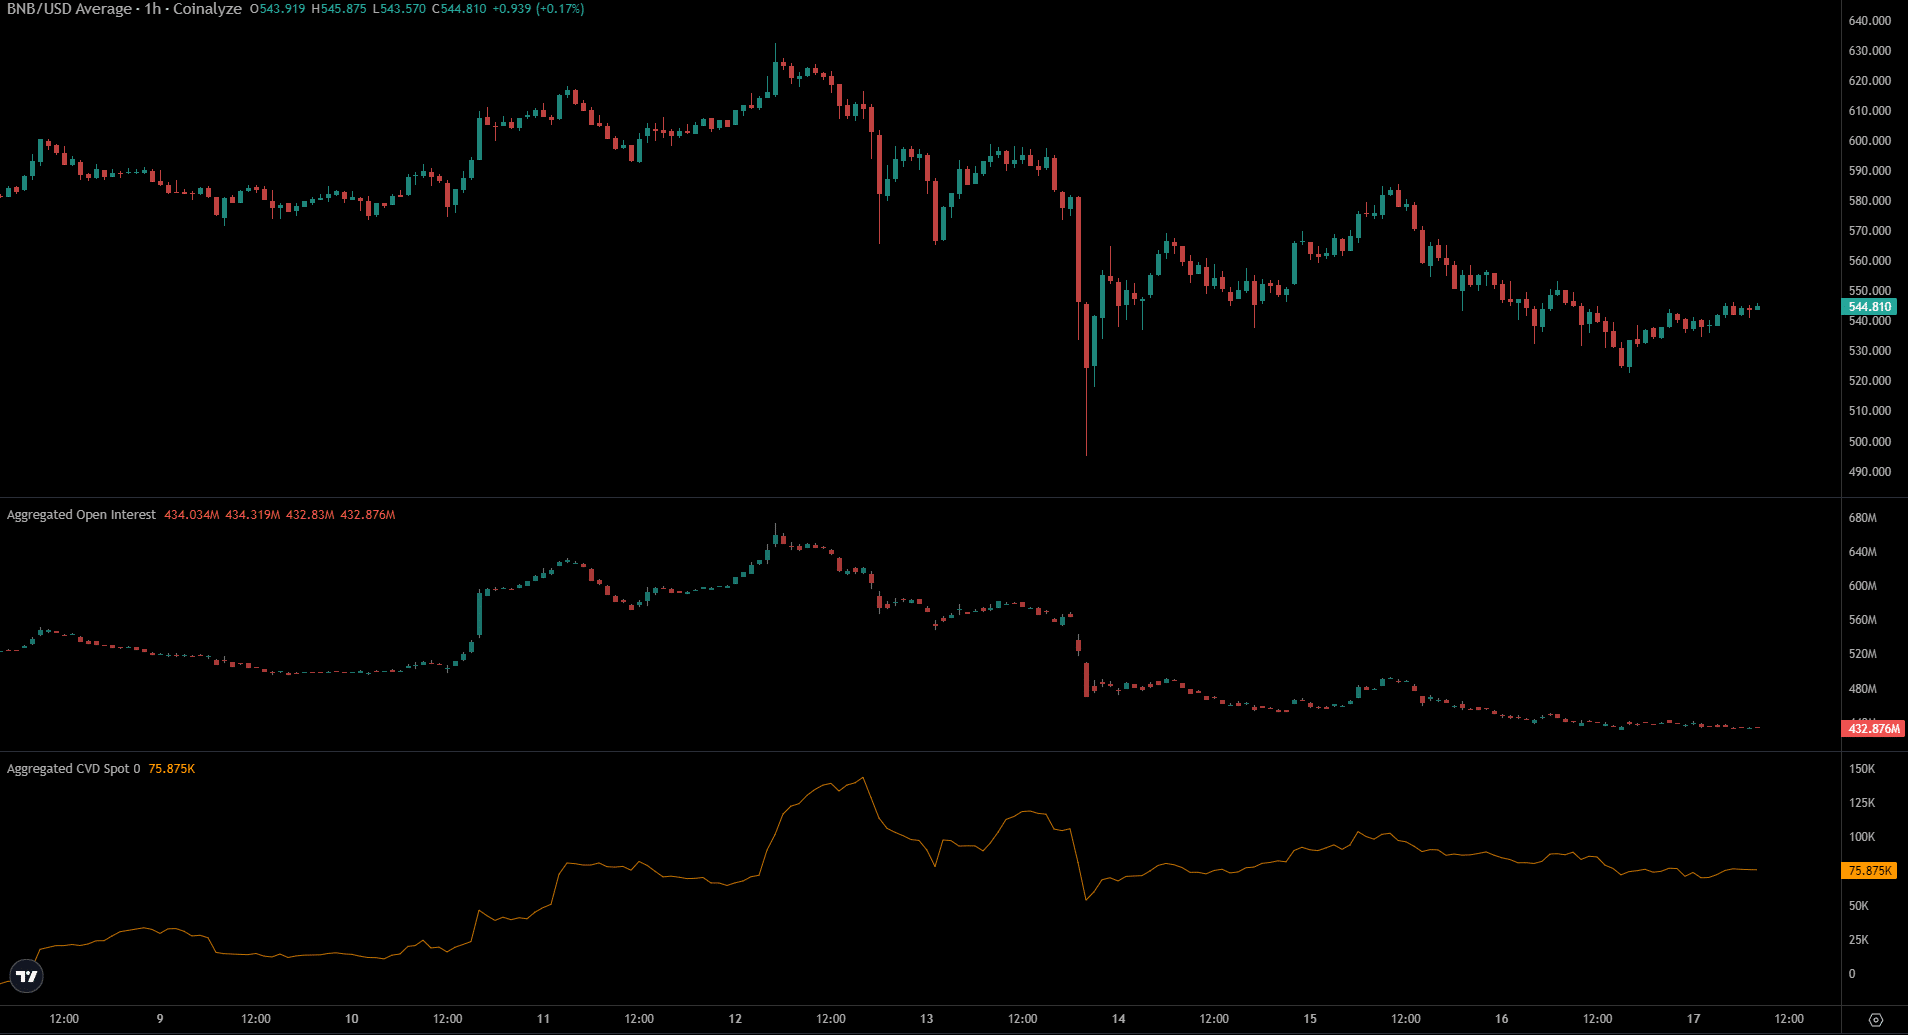
Source: Coinalyze
AMBCrypto saw that the Open Interest chart has been dormant since the massive drops on the 13th of April. This suggested speculators were afraid to long BNB and preferred to wait for the volatility to decrease.
Conversely, the spot CVD moved higher strongly on the 14th of April. Since then, it began to decrease gradually. An influx of demand could keep prices above the $505 range lows.
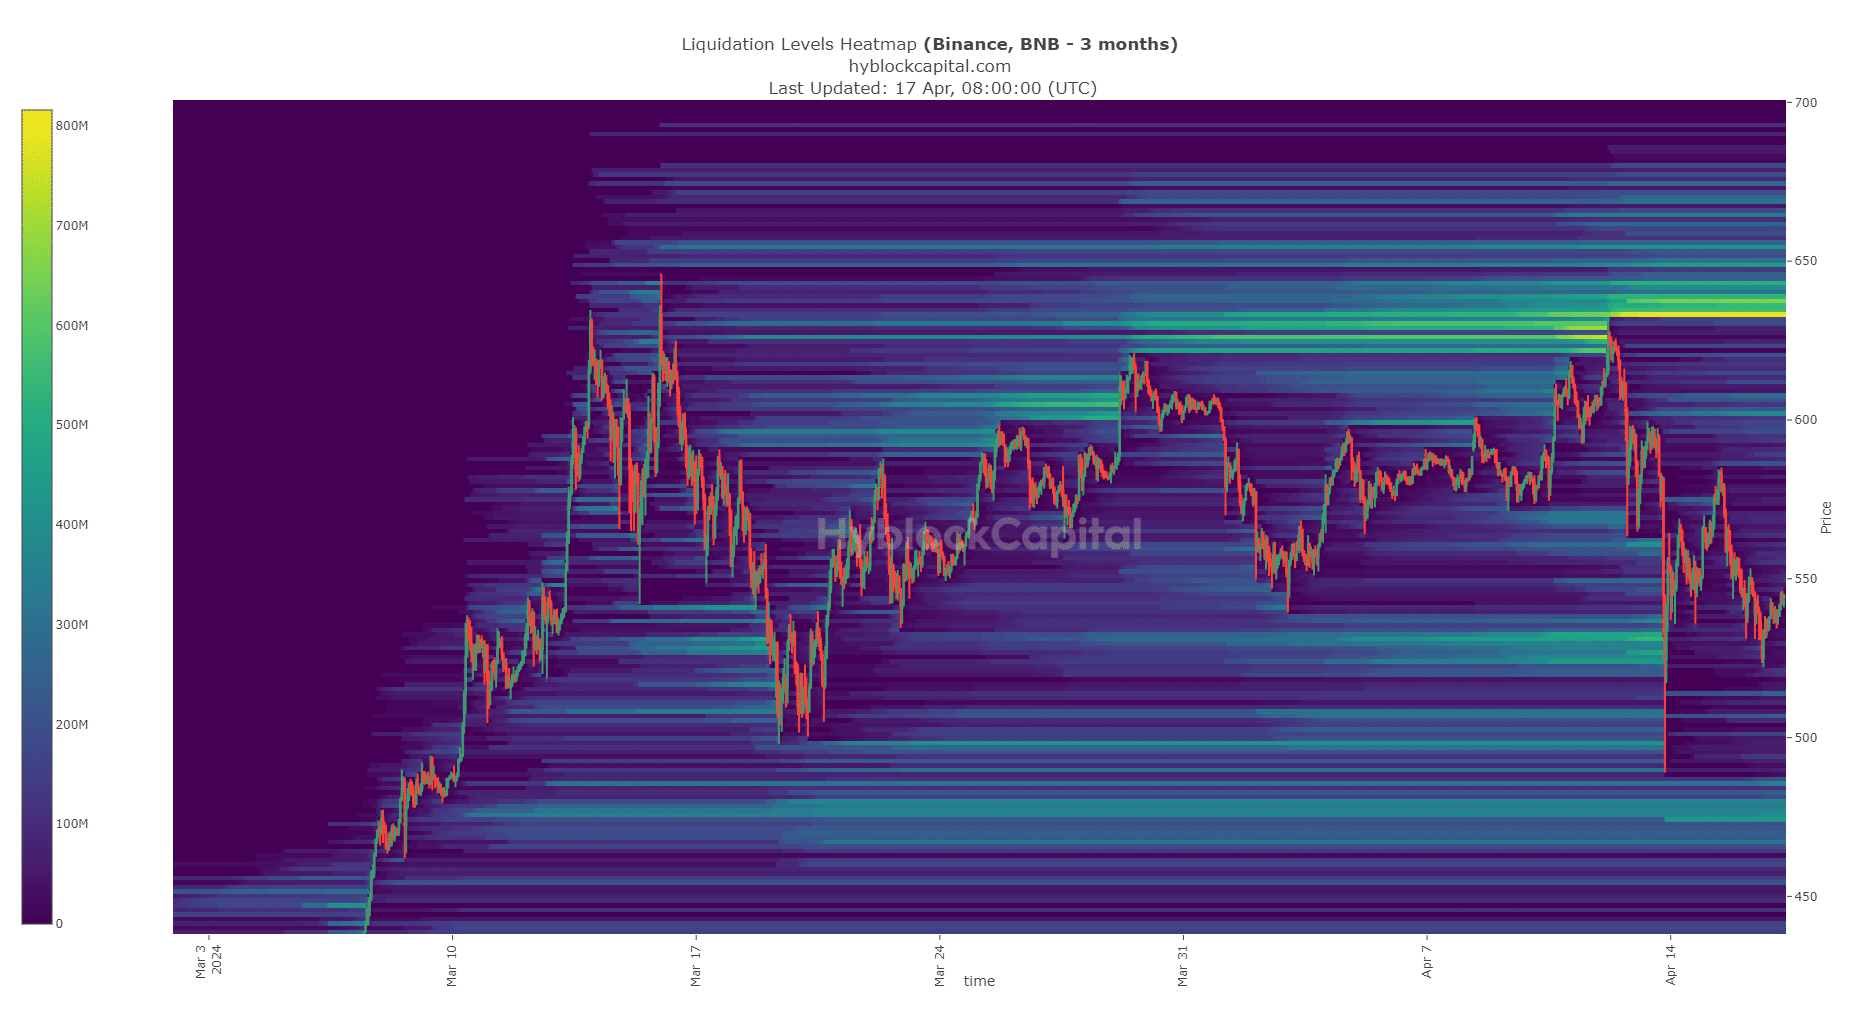
Source: Hyblock
Is your portfolio green? Check out the BNB Profit Calculator
The liquidation heatmap showed that the $475 level was the next region of interest. The $500-$510 area did not have many liquidation levels. This meant that the liquidity pocket at $475 was the next magnet zone.
Overall, the indicators favored a move toward the $460-$475 region. However, some doubts persisted, and a bullish resurgence was not impossible.