- Bearish sentiment around BNB increased as its price fell.
- Market indicators and metrics hinted at a trend reversal.
The crypto market witnessed a crash in the last few hours as most cryptos’ values, including Binance Coin [BNB], dropped.
However, the trend might be short-lived as BNB’s price was consolidating inside a pattern, and a breakout could result in a massive bull rally.
BNB’s chart turns red
As top cryptos like Bitcoin [BTC] and Ethereum [ETH] witnessed corrections, BNB also followed the trend, as its price dropped by more than 1.7% in the last 24 hours.
According to CoinMarketCap, at the time of writing, the coin was trading at $583.63 with a market capitalization of over $86.1 billion.
But there was more to the story, as despite the price decline, BNB was consolidating inside a bullish pennant pattern.
World Of Charts, a popular crypto analyst, recently posted a tweet highlighting this pattern. As per the tweet, if the coin tests this pattern and breaks out successfully, then investors might witness a massive bull rally.
In fact, the rally might as well clear BNB’s path towards $1000 in the coming weeks.
What to expect in the short term?
Since the road to $1000 seemed long and ambitious, AMBCrypto checked BNB’s metrics to find out what to expect from the coin in the short term.
As per our analysis of Santiment’s data, the coin’s Social Volume increased while its price dropped. The negative price action also resulted in BNB’s Weighted Sentiment dropping, meaning that bearish sentiment increased.
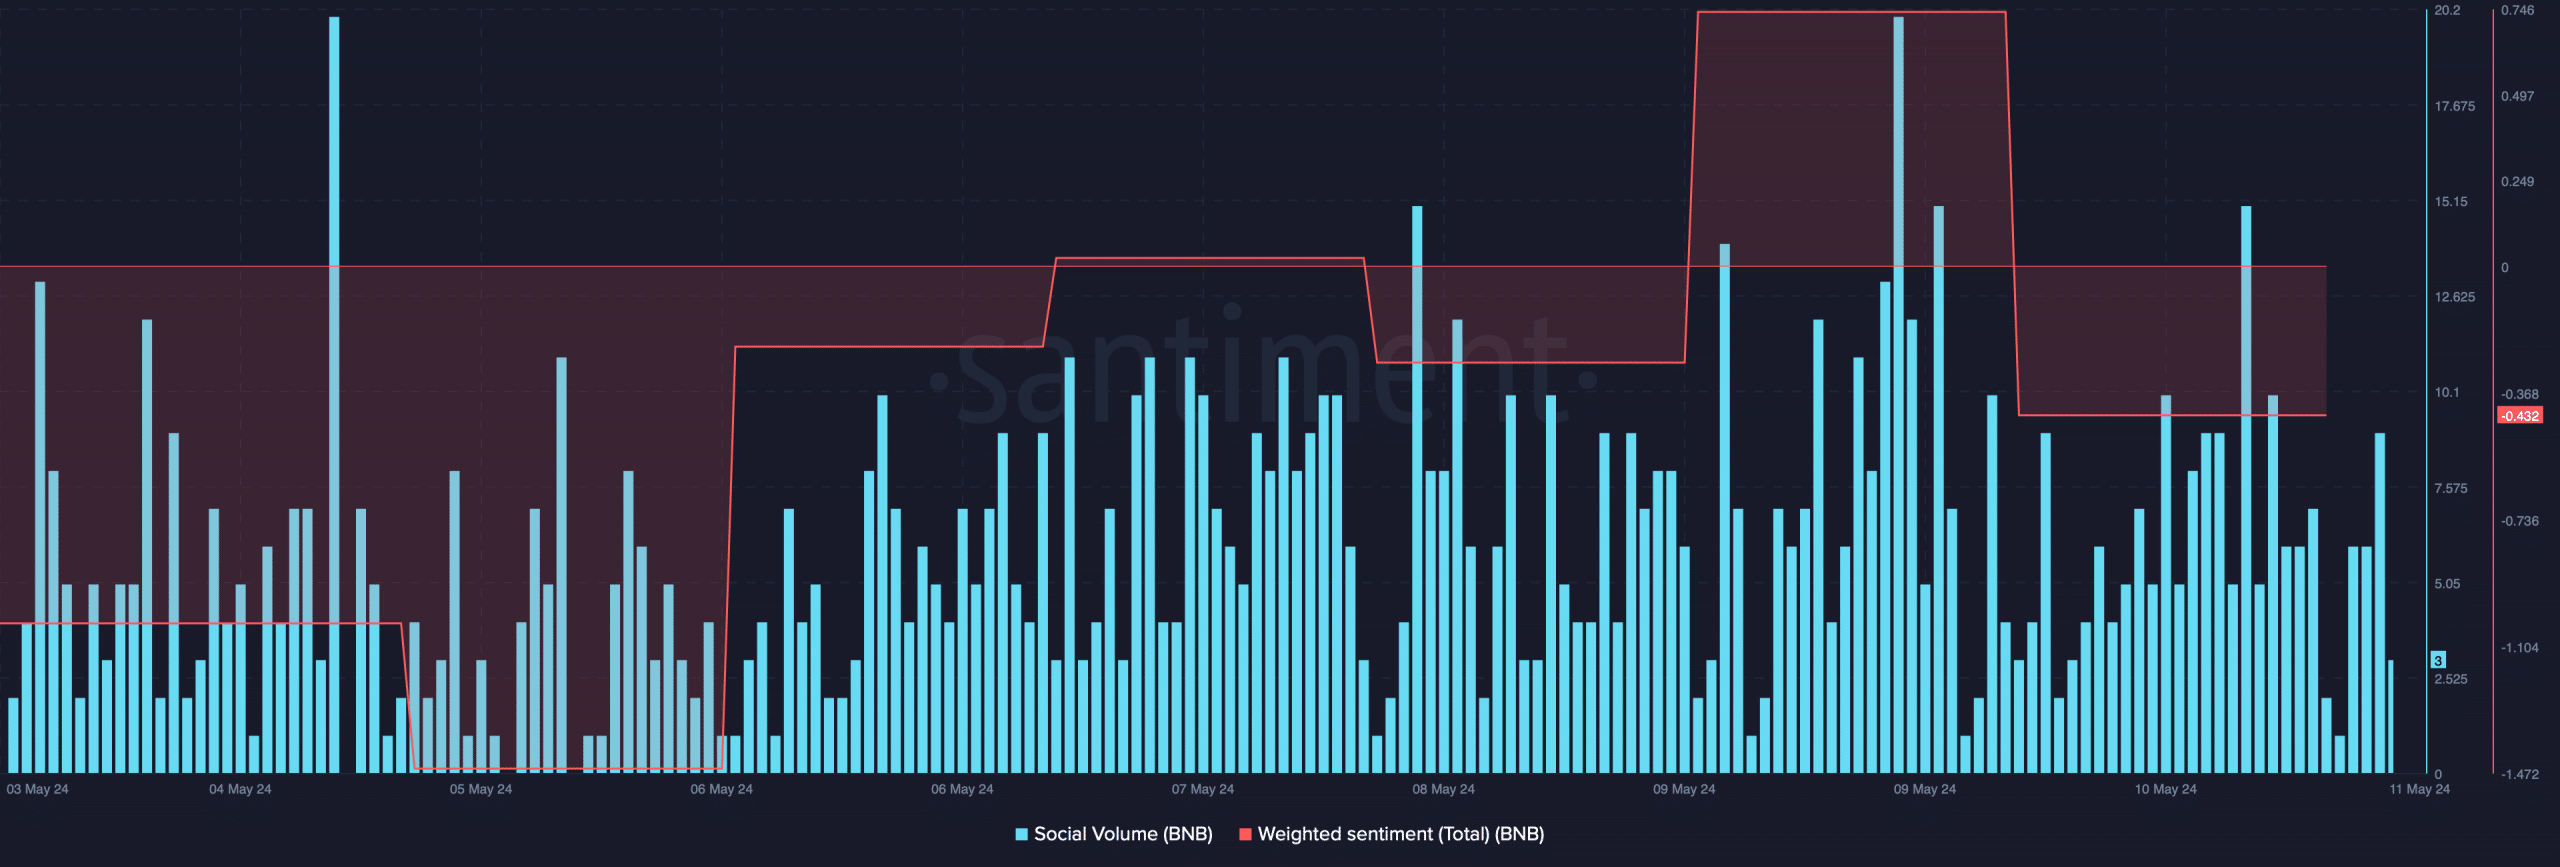
Source: Santiment
However, while the coin’s price declined, its trading volume also sank by 14%. Generally, a drop in trading volume indicates that the ongoing price trend might not last long. BNB’s Funding Rate also turned red.
As prices tend to move in a different direction than the Funding Rate, it seems likely that a trend reversal will happen soon.
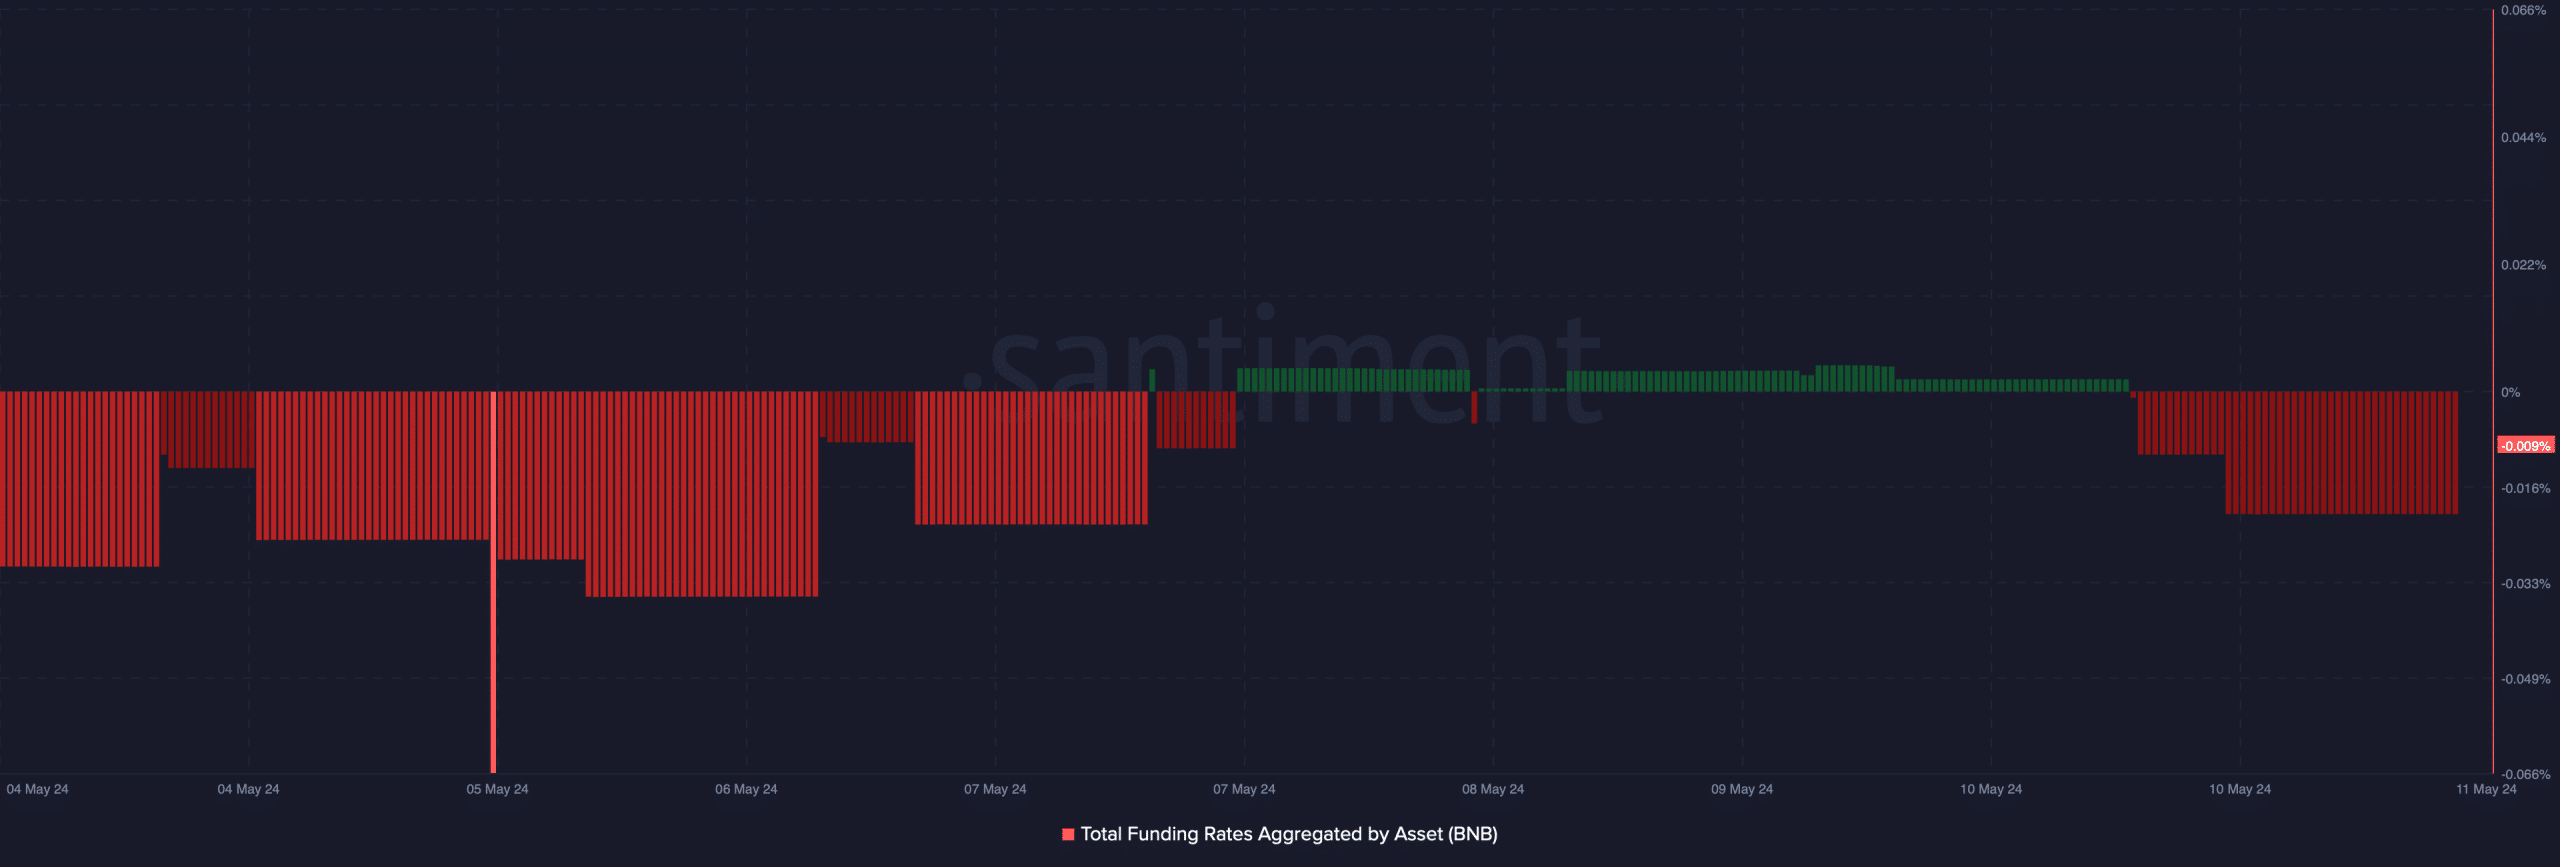
Source: Santiment
We then checked BNB’s daily chart to see what indicators had to suggest. As per our analysis, the coin’s Money Flow Index (MFI) went sideways over the last few days.
The Relative Strength Index (RSI) also followed a similar trend, suggesting that investors might witness a few slow-moving days.
As per the Bollinger Bands, the coin’s price was in a less-volatile zone, meaning that the chances of an unprecedented price decline were low.
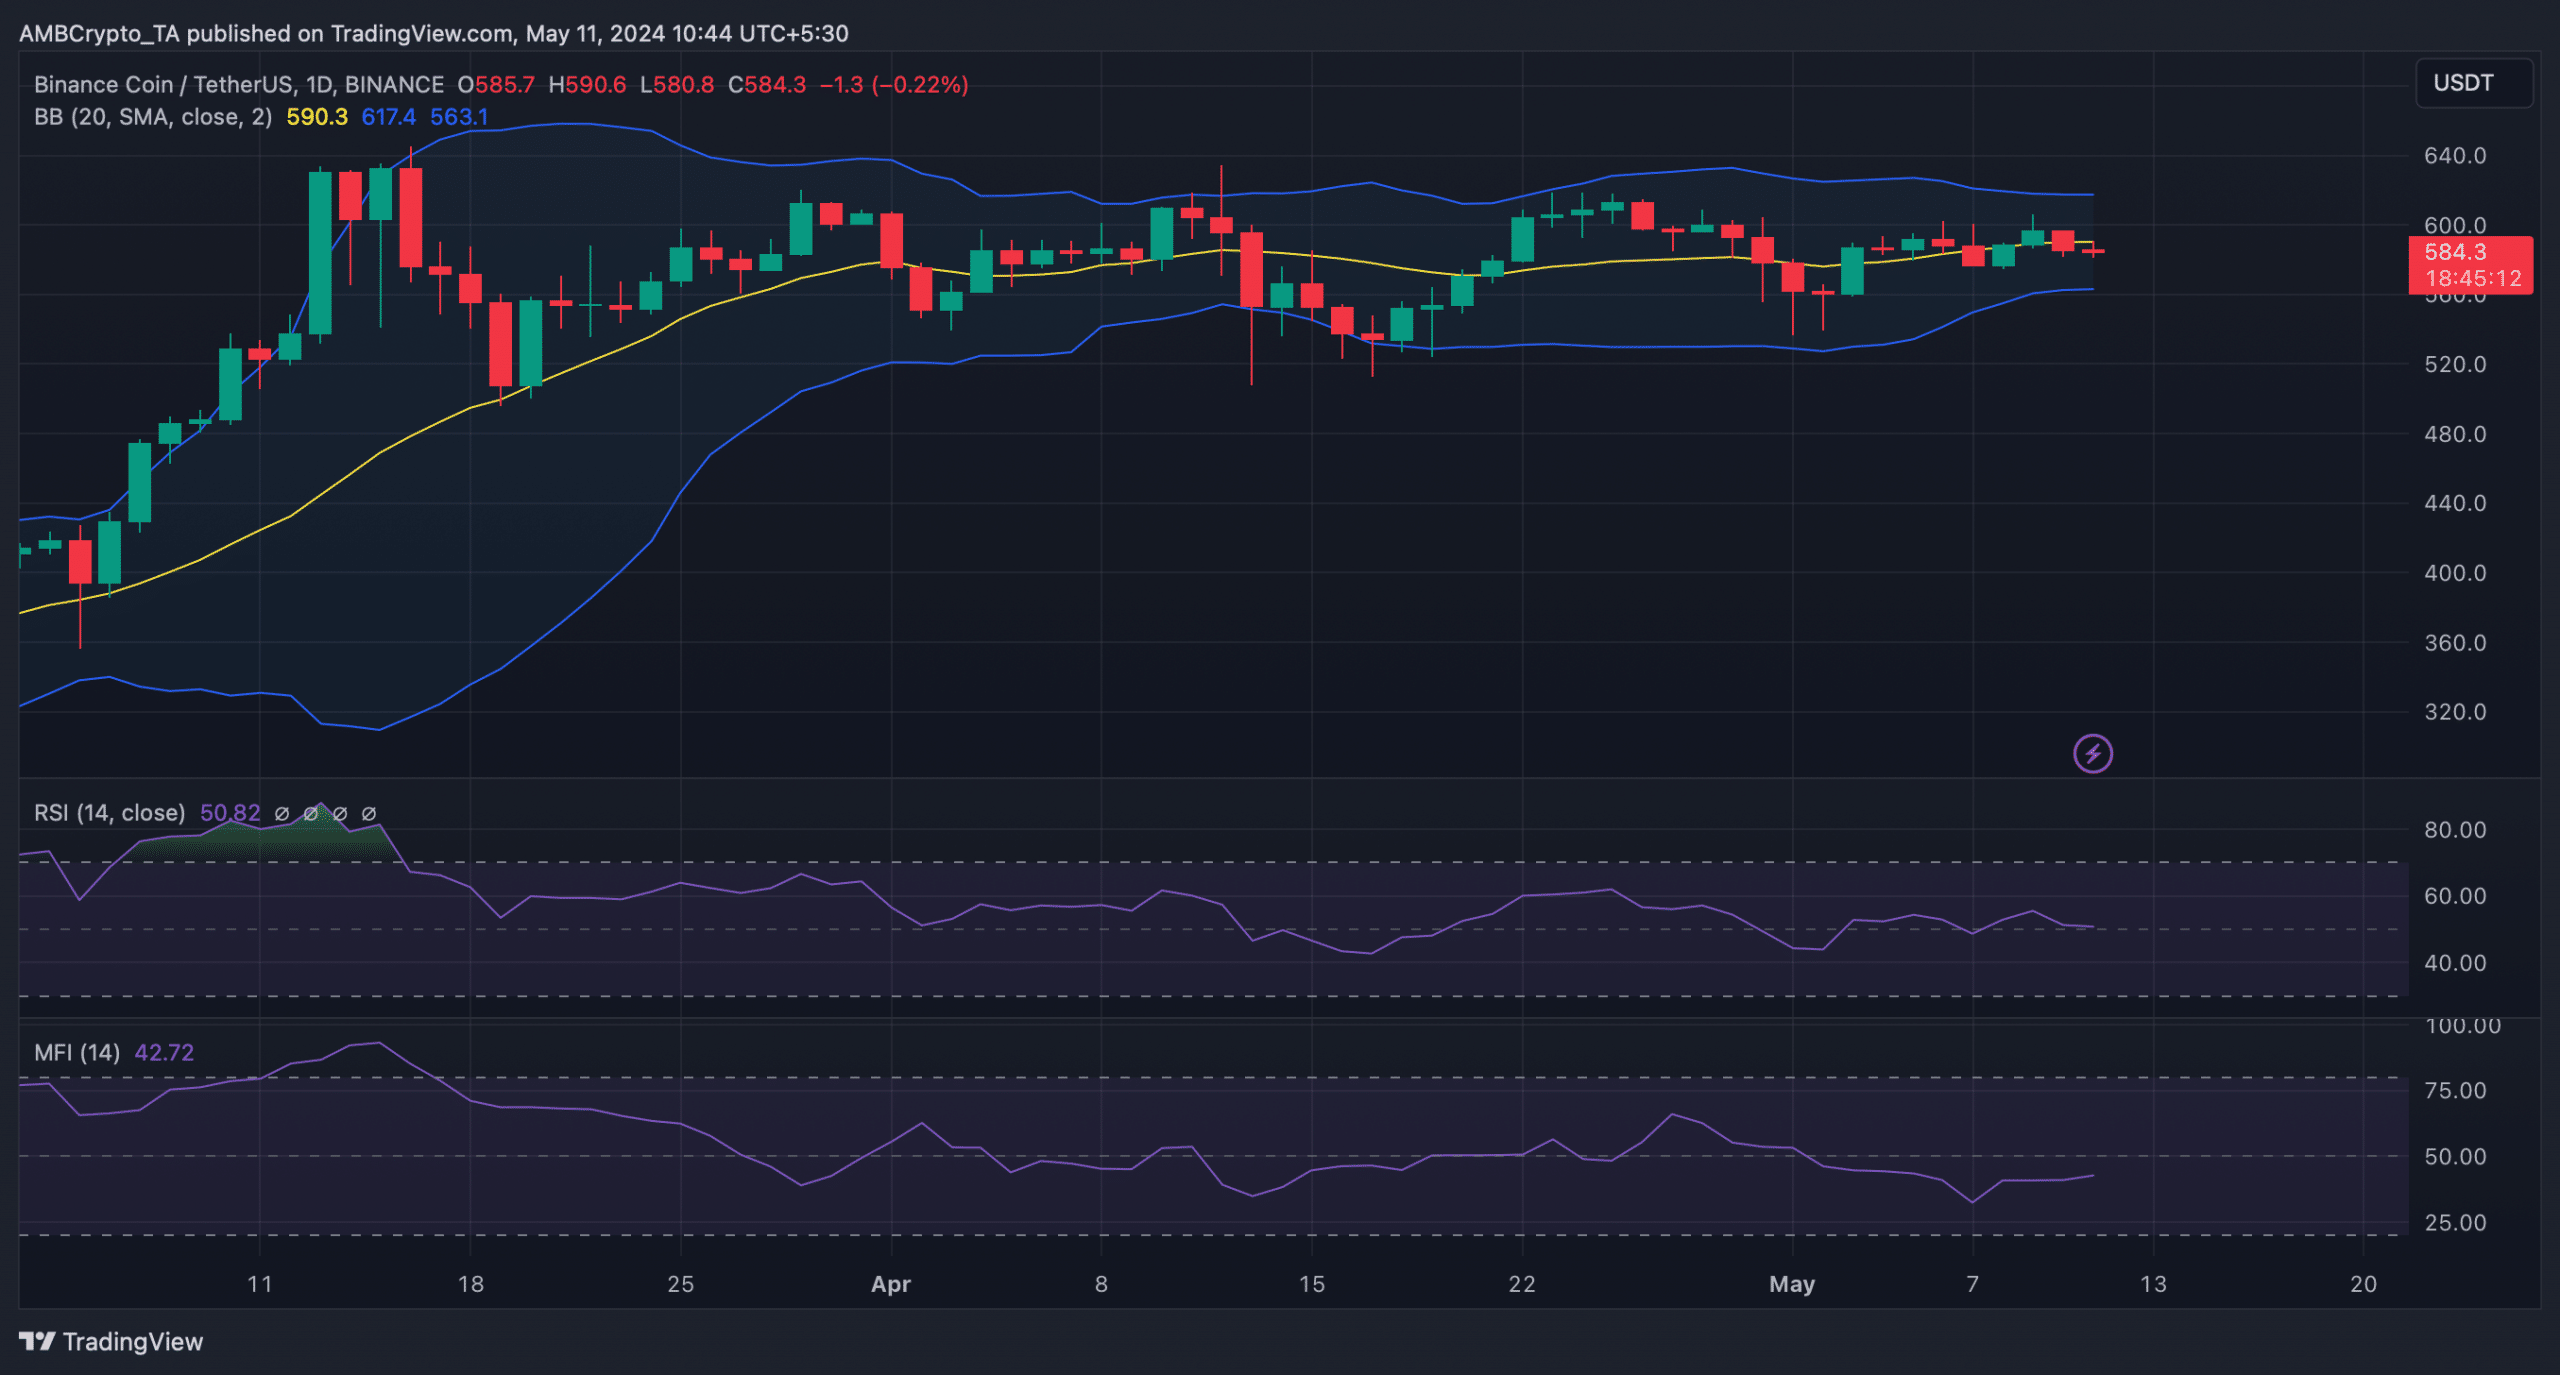
Source: TradingView
Is your portfolio green? Check out the BNB Profit Calculator
A look at the coin’s liquidation heatmap revealed that liquidation would rise sharply near the $573 mark.
Therefore, BNB’s price might drop to that level before moving up again if bears deny letting go in the coming few days.

Source: Hyblock Capital