BNB’s 8% rally stalls! – Examining why traders should be cautious
The BNB short-term range formation has caused increased volatility, and traders should beware of a false breakout.

- BNB has a bullish bias on the 1-day timeframe.
- It was stuck in a short-term consolidation phase, but long position entries around $640 appeared favorable.
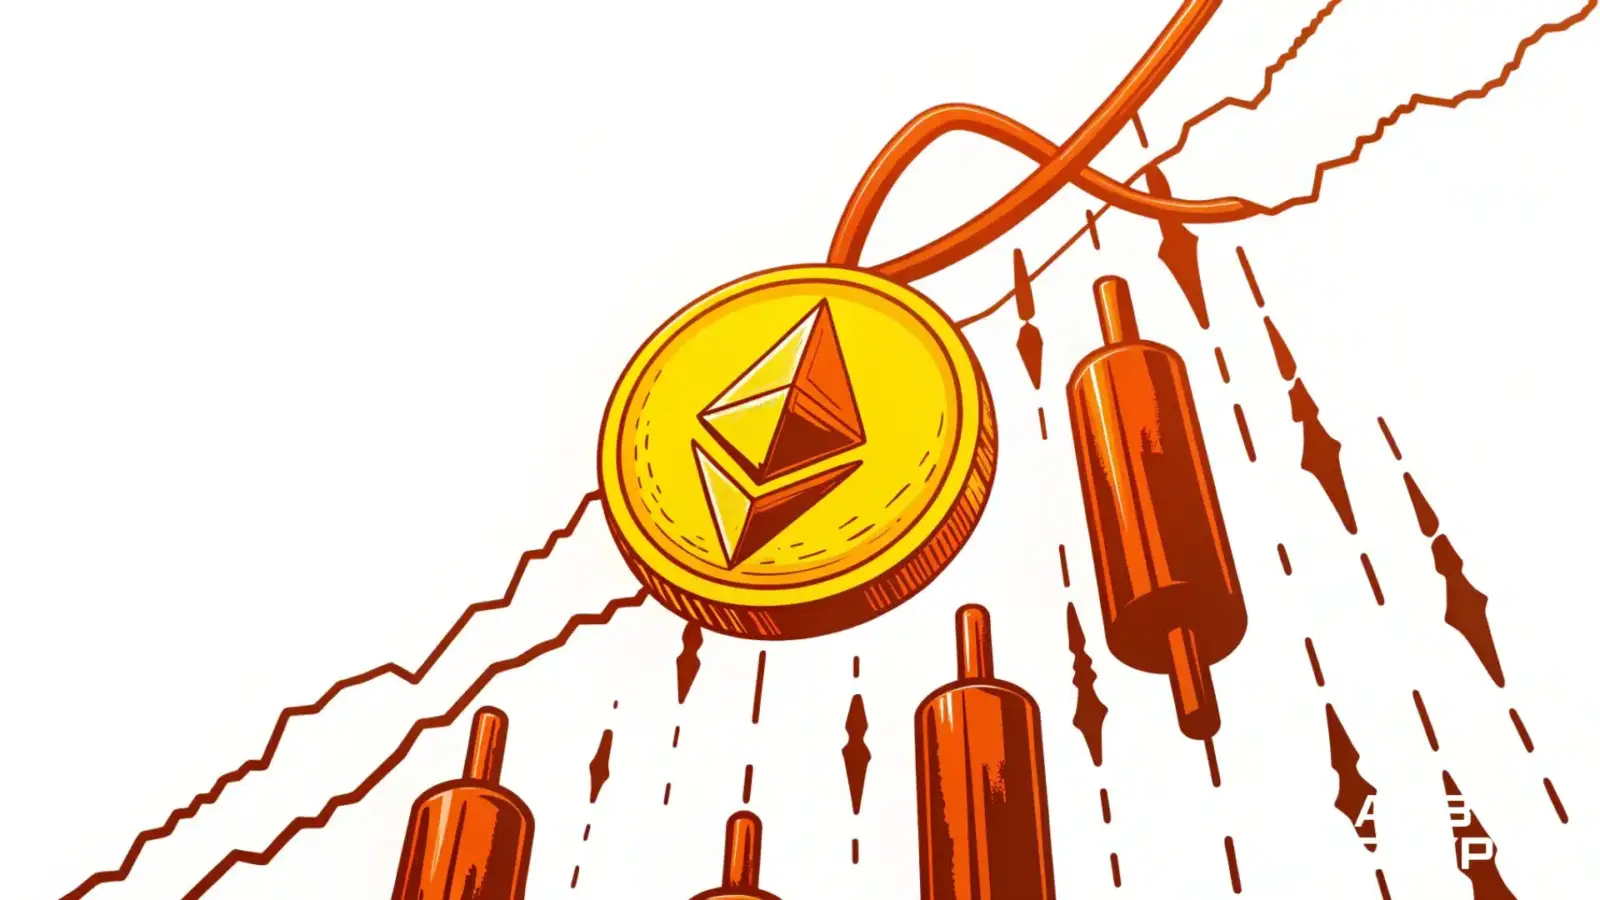
Binance Coin [BNB] has rallied 8.5% in the past week, compared to Bitcoin’s [BTC] 6.27%. This was a sizeable underperformance from BNB compared to many altcoins. For example, Ethereum [ETH] was up 41% over the past week.
The lack of relative strength for BNB tied in well with what was highlighted in an earlier report.
AMBCrypto highlighted that a lack of demand meant that bulls might be inadequate to the task of driving a breakout beyond the range. A retest of the mid-range support was anticipated, but this has not arrived either.
BNB consolidates around $660, traders should be beware of…

On the daily chart, BNB retained a bullish market structure after breaching the $618 resistance in late April. It then pushed past the $630–$640 zone, reinforcing near-term bullish control.
Unfortunately for bullish traders, the price action has remained flat for five days. The CMF continued to show heavy capital inflows, and the MACD noted upward momentum.
Still, the Stochastic RSI showed a bearish crossover, suggesting a potential short-term dip.

The 4-hour chart showed another short-term range formation. More importantly, it highlighted how Binance Coin was driven toward liquidity pockets over the past few days.
After establishing a range (purple), the exchange token made a swing high at $693,2% above the range high. Sixteen hours later, the price dived by 7.5% to a low of $640.8.
What’s next? – More chop likely—traders tread lightly
Since then, the price has climbed back within the range. However, the H4 MACD showed bearish momentum, and the CMF did not indicate sizeable capital inflows.
In this scenario, further consolidation appeared likely. Traders can use a deviation below the range low to go long, but should be cautious about longing a breakout past $678.
Disclaimer: The information presented does not constitute financial, investment, trading, or other types of advice and is solely the writer’s opinion