BNB’s lull period: Should you take this time to accumulate?
The range formation of the past two months extended from $506 to $633, but BNB might break free soon.

- The BNB market has not trended in the past two months, but traders still have opportunities.
- Investors can take heart from the similarities between the early 2024 consolidation and the current one.
Binance Coin [BNB] traded within a range in the past two months. Two levels within the range were of particular interest to swing traders.
In an earlier report, AMBCrypto highlighted these levels, noting that the BNB market was in a consolidation phase.
The Weighted Sentiment behind the exchange token was negative, which suggested market participants might not be keen to buy it.
Yet, the technical indicators and the price action suggested that an upward breakout was more likely than a downward move in the coming weeks.
A look at the January consolidation shows where BNB could head next
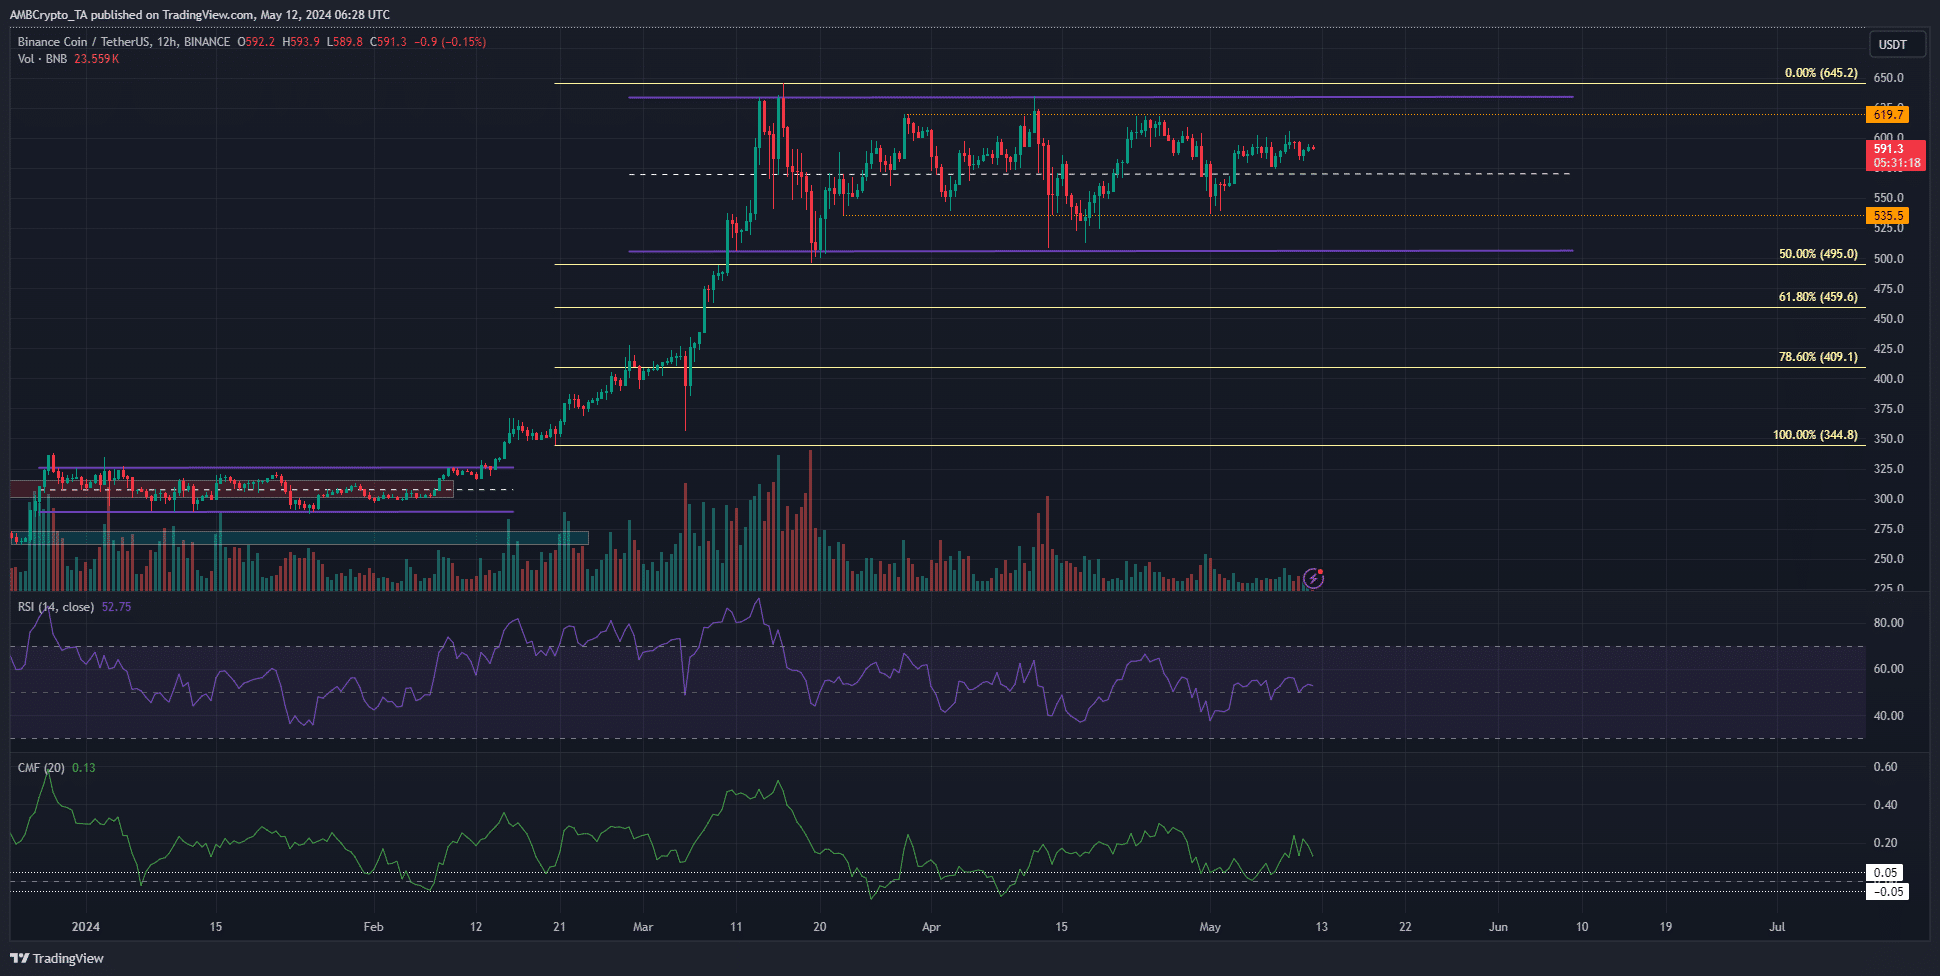
The range formation of the past two months was highlighted in purple. It extended from $506 to $633. Over the past six weeks, BNB has traded within the $619-$535 area, marking these as important levels as well.
Comparing the current consolidation phase to the one earlier in 2024, we see similarities in the volume traded. Toward the end of the consolidation, volume was minimal.
A breakout past the $310 resistance zone and the $327 range high boosted the volume.
At press time, the volume was small compared to March. However, the price was above the mid-range level at $571. The 12-hour RSI showed momentum was neutral with a reading of 52.75, but the CMF was positive.
This indicated capital inflows to the market were significant and outlined buying pressure. If Bitcoin [BTC] could recover its uptrend, it might give BNB the space to rally higher too.
Marking the liquidity pockets
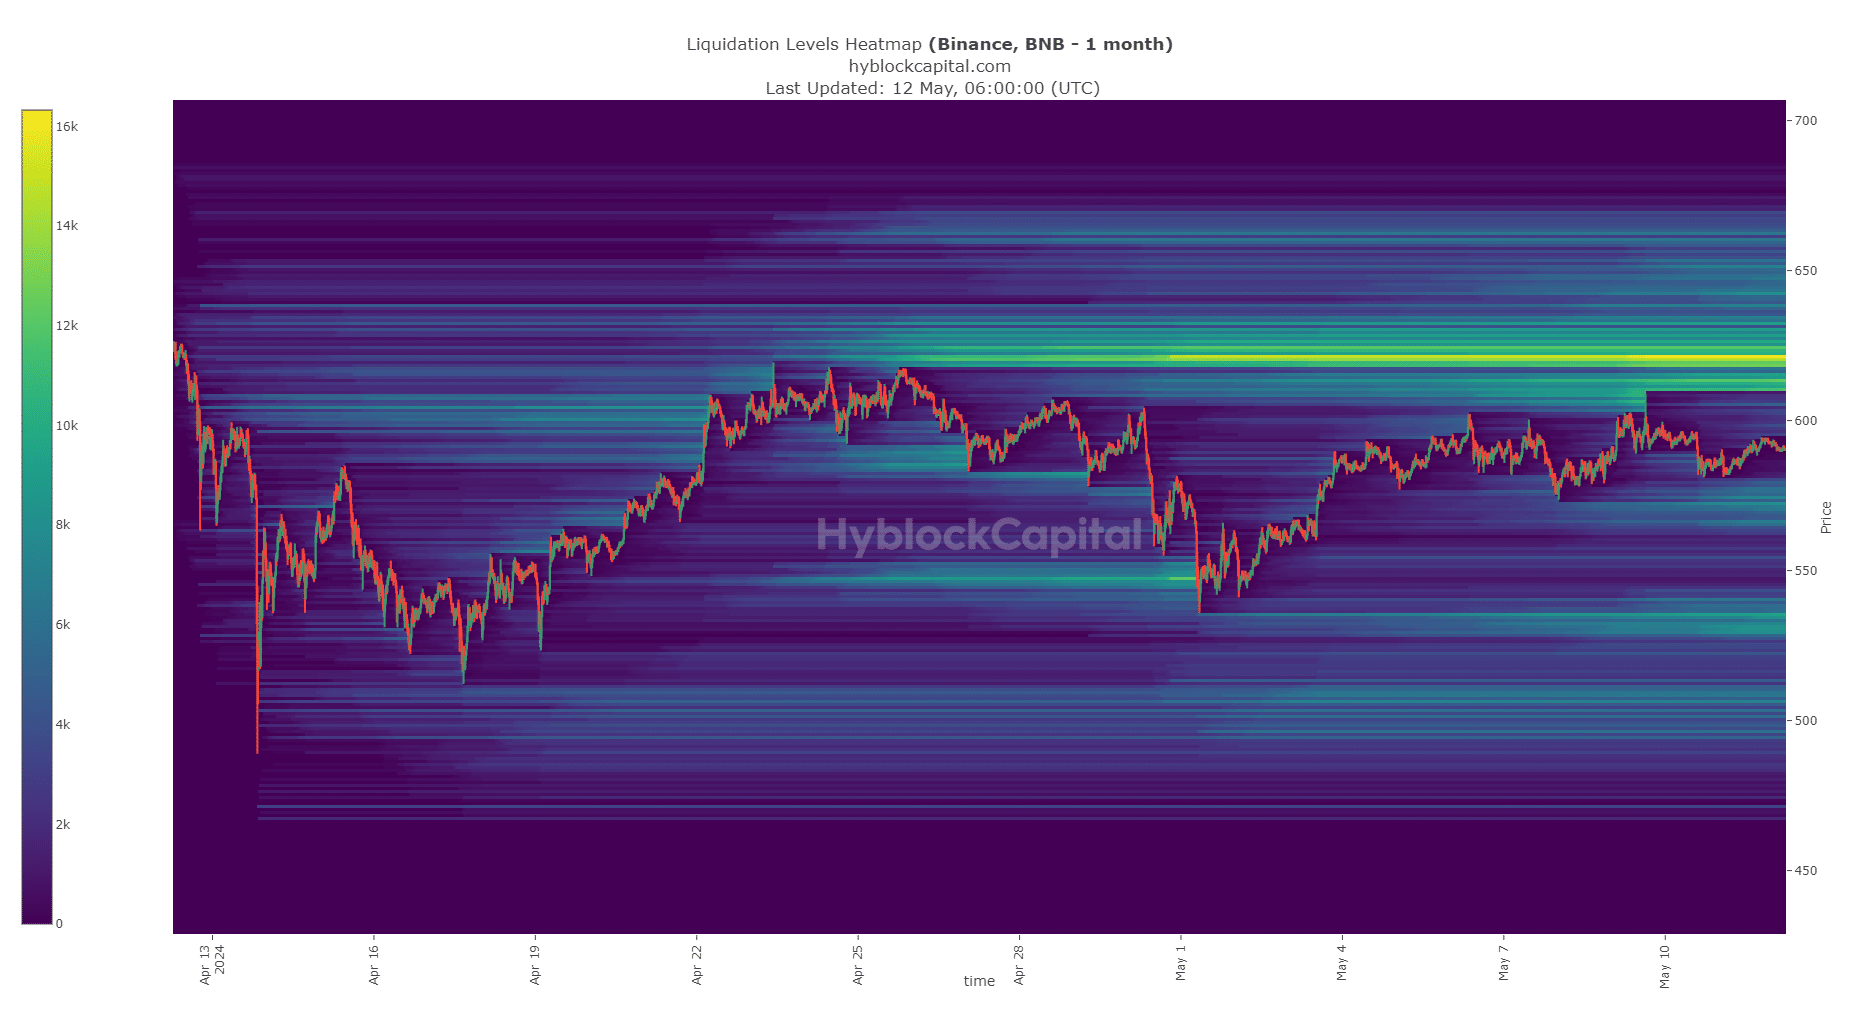
The $619 and $535 levels were key from a price action perspective. The liquidation heatmap of the past month also indicated that the $615-$625 region was a magnetic zone for the price.
Is your portfolio green? Check out the BNB Profit Calculator
Hence, BNB could visit this region and fall lower.
To the south, the smaller pockets of liquidity at $570 and $535 were the ones to watch, where BNB could drop before a bullish reversal.
Disclaimer: The information presented does not constitute financial, investment, trading, or other types of advice and is solely the writer’s opinion.


