BNB’s moves stir the market: Is $600 closer than you think?
If BNB breaks out of its bull pattern, the coin could touch $600 in the coming week.

- BNB was up by more than 1.8% in the last 24 hours.
- Most metrics and indicators looked bullish on the coin.
After a week-long price decline, Binance Coin [BNB] gained bullish momentum as its daily chart turned green. In fact, things can get even better next week, as BNB’s price is moving inside a bull pattern.
Does this mean BNB will reach new highs soon?
A bull pattern forms on BNB’s chart
According to CoinMarketCap, BNB bears dominated the market over the last week, as the coin’s value dropped by over 3%.
However, things changed in investors’ favor as its price surged by more than 1.8% in the last 24 hours. At the time of writing, the coin was trading at $587.39 with a market capitalization of over $87 billion.
In the meantime, AMBCrypto analysis of the coin’s daily chart revealed that the coin’s price was moving inside a bullish symmetrical triangle pattern.
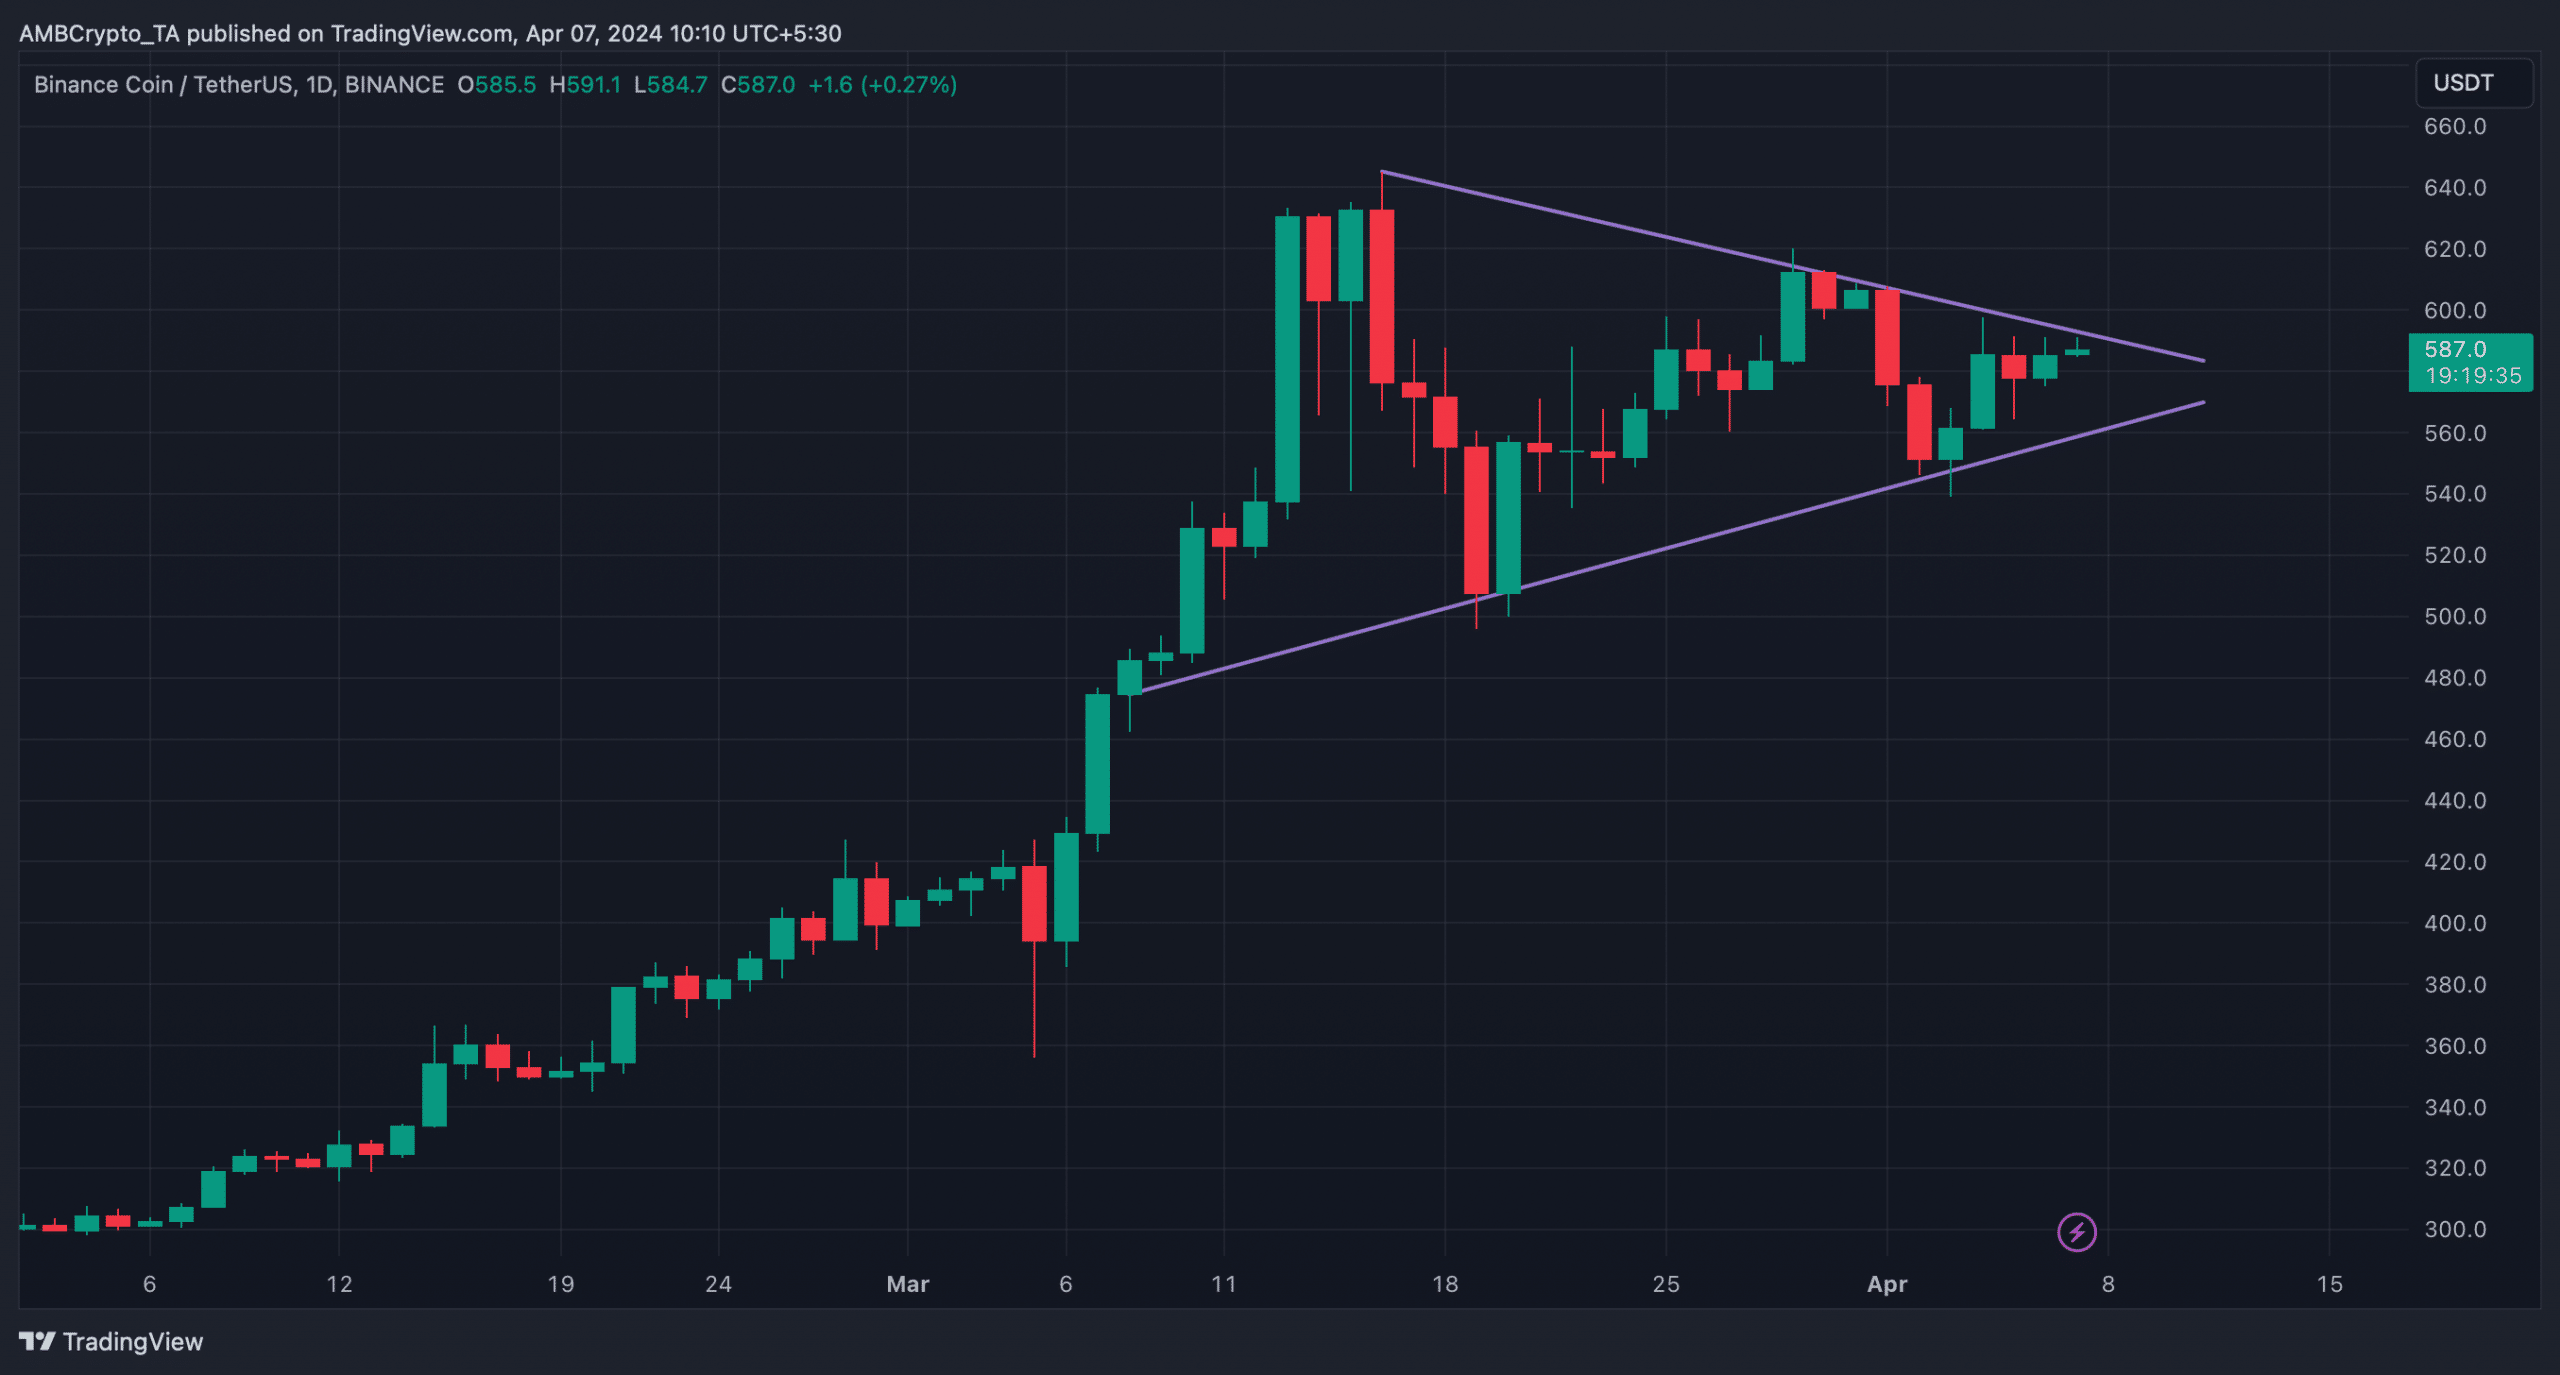
A breakout from such a pattern often results in bull rallies, suggesting that BNB investors might soon enjoy massive profits.
To be precise, in order for BNB to initiate a bull rally, it must break above the resistance zone at $590. So, AMBCrypto examined Hyblock Capital’s data to see the next possible target levels.
Our analysis revealed that BNB’s liquidation will rise sharply near $600. Therefore, if a northbound price movement happens, the first viable target seems to be $600.
Going further north, if the coin crosses $600 successfully, then the next target could be $630.

Will BNB breakout?
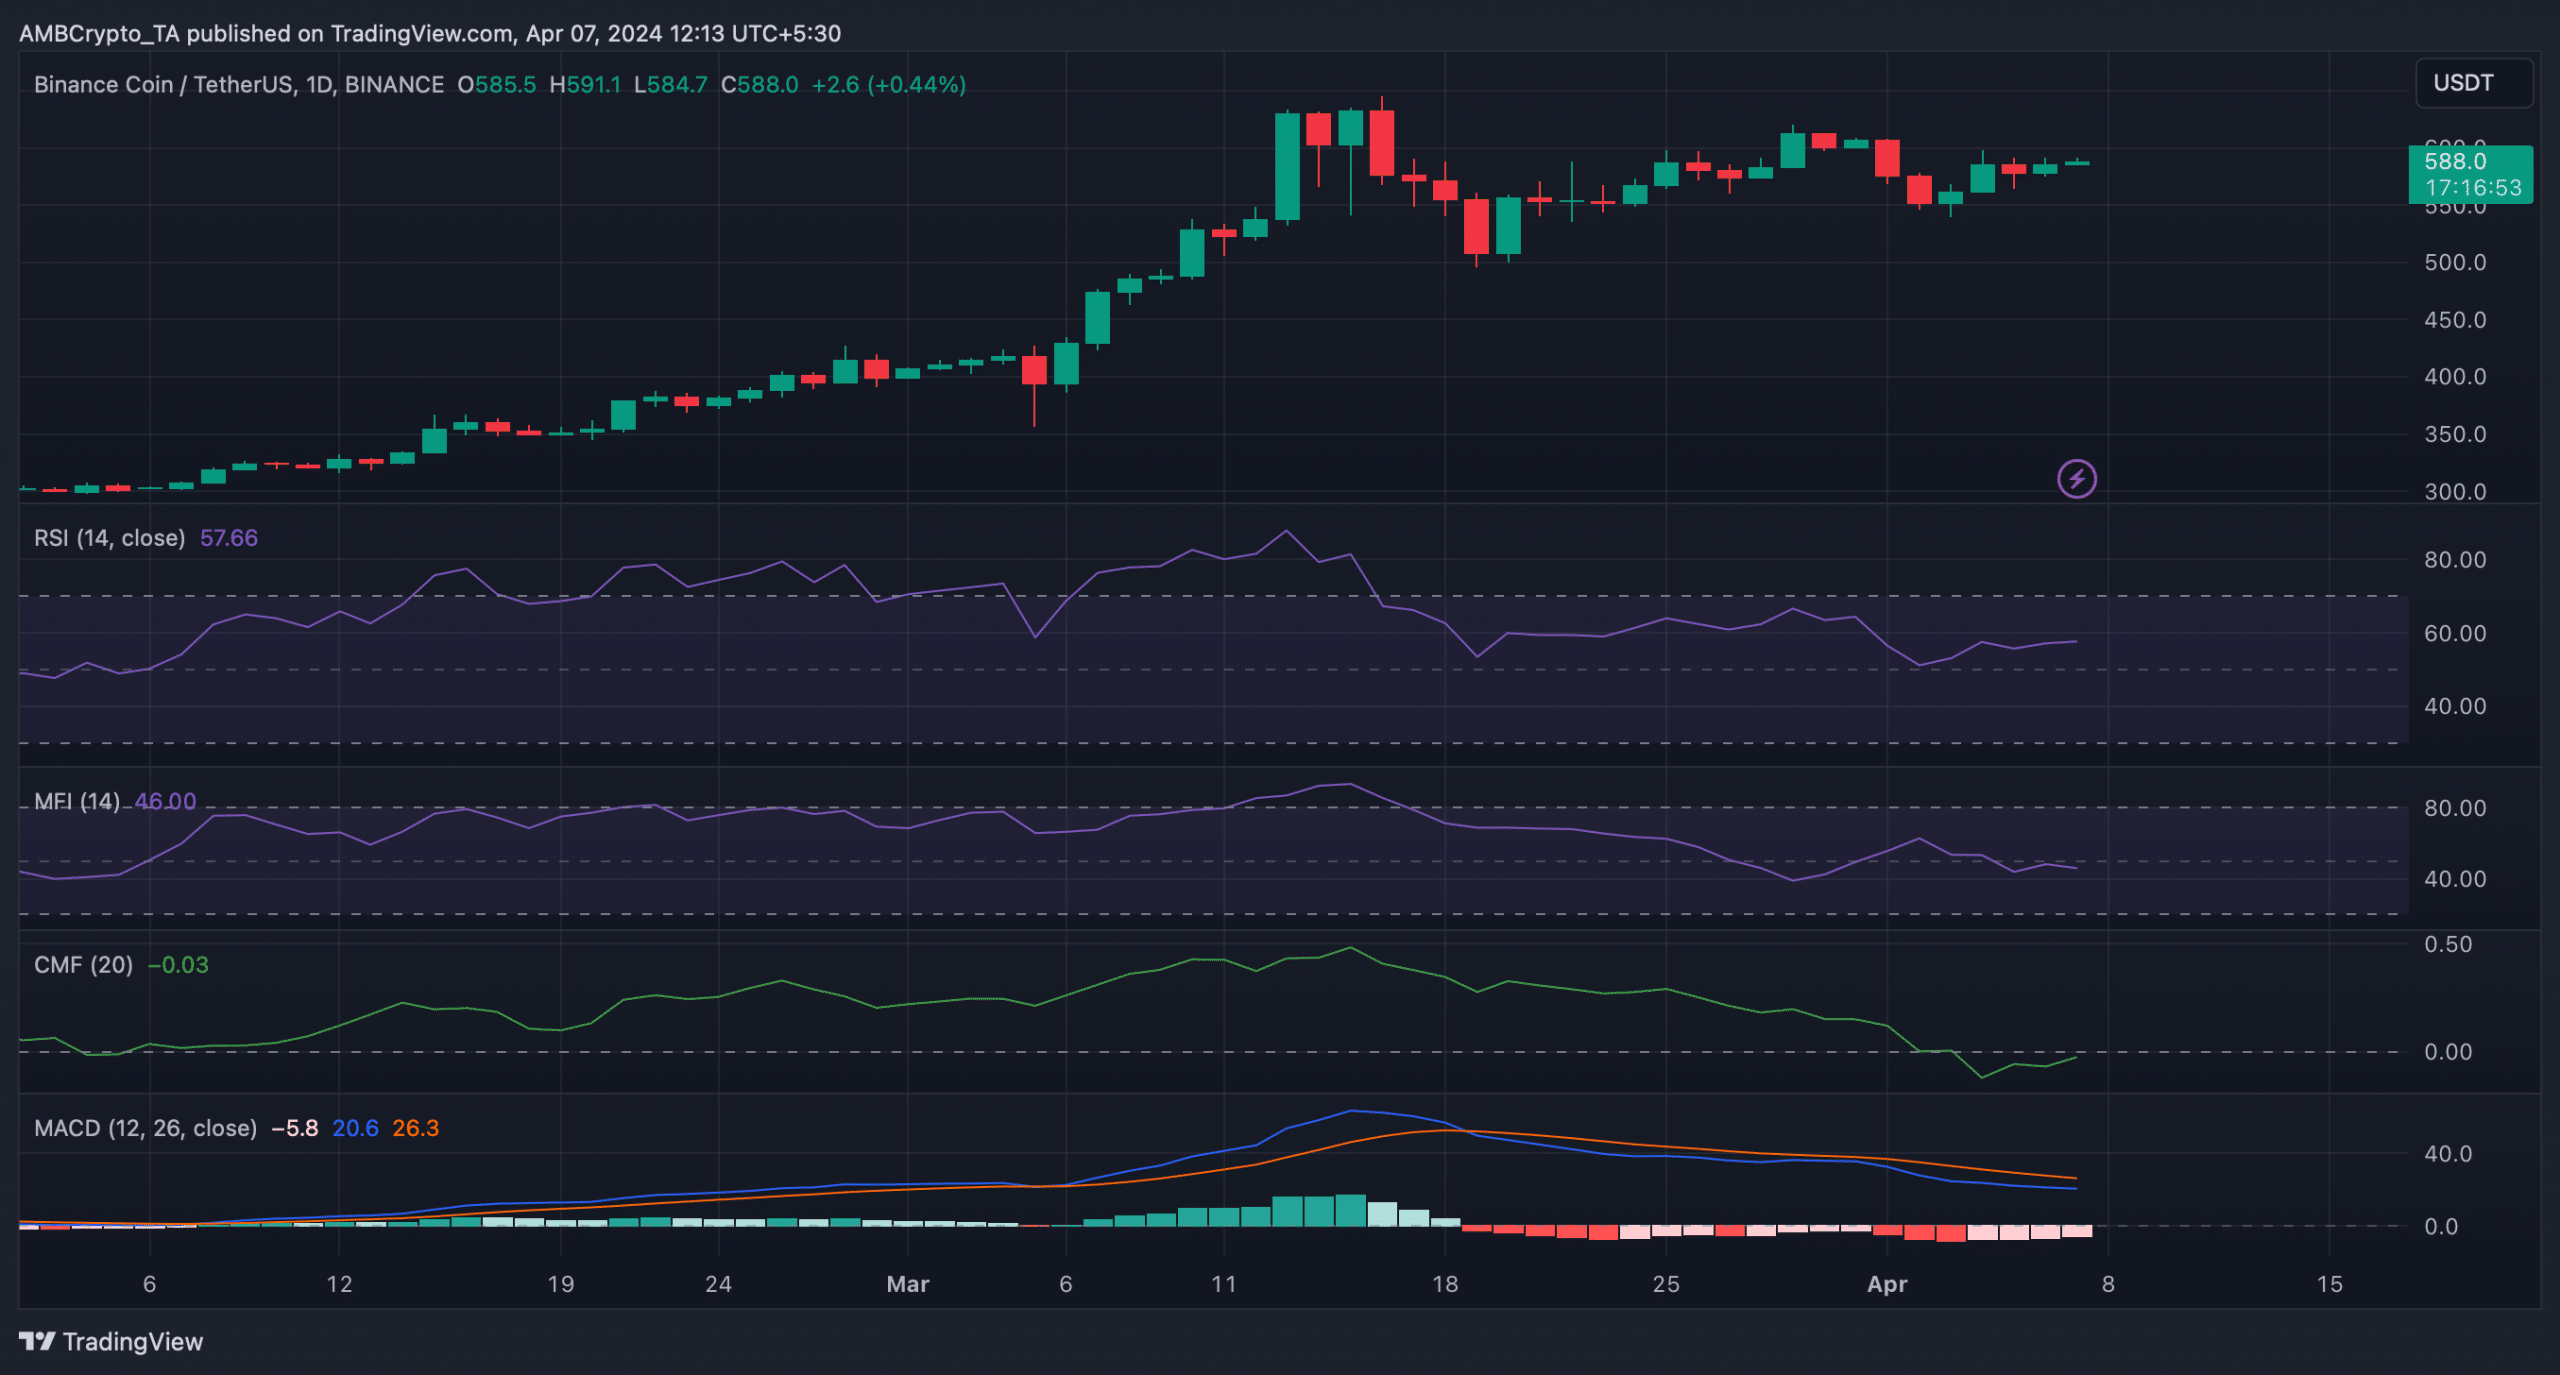
AMBCrypto checked the coin’s technical indicators to see how likely it is for the coin to break above the bull pattern. We found that the coin’s Relative Strength Index (RSI) registered an uptick.
The Chaikin Money Flow (CMF) also followed a similar increasing trend, while the MACD displayed the possibility of a bullish crossover.
All these technical indicators hinted that the chances of BB crossing $590 were high.
Nonetheless, the Money Flow Index (MFI) moved sideways, which suggested that investors might as well witness a few more slow-moving days.
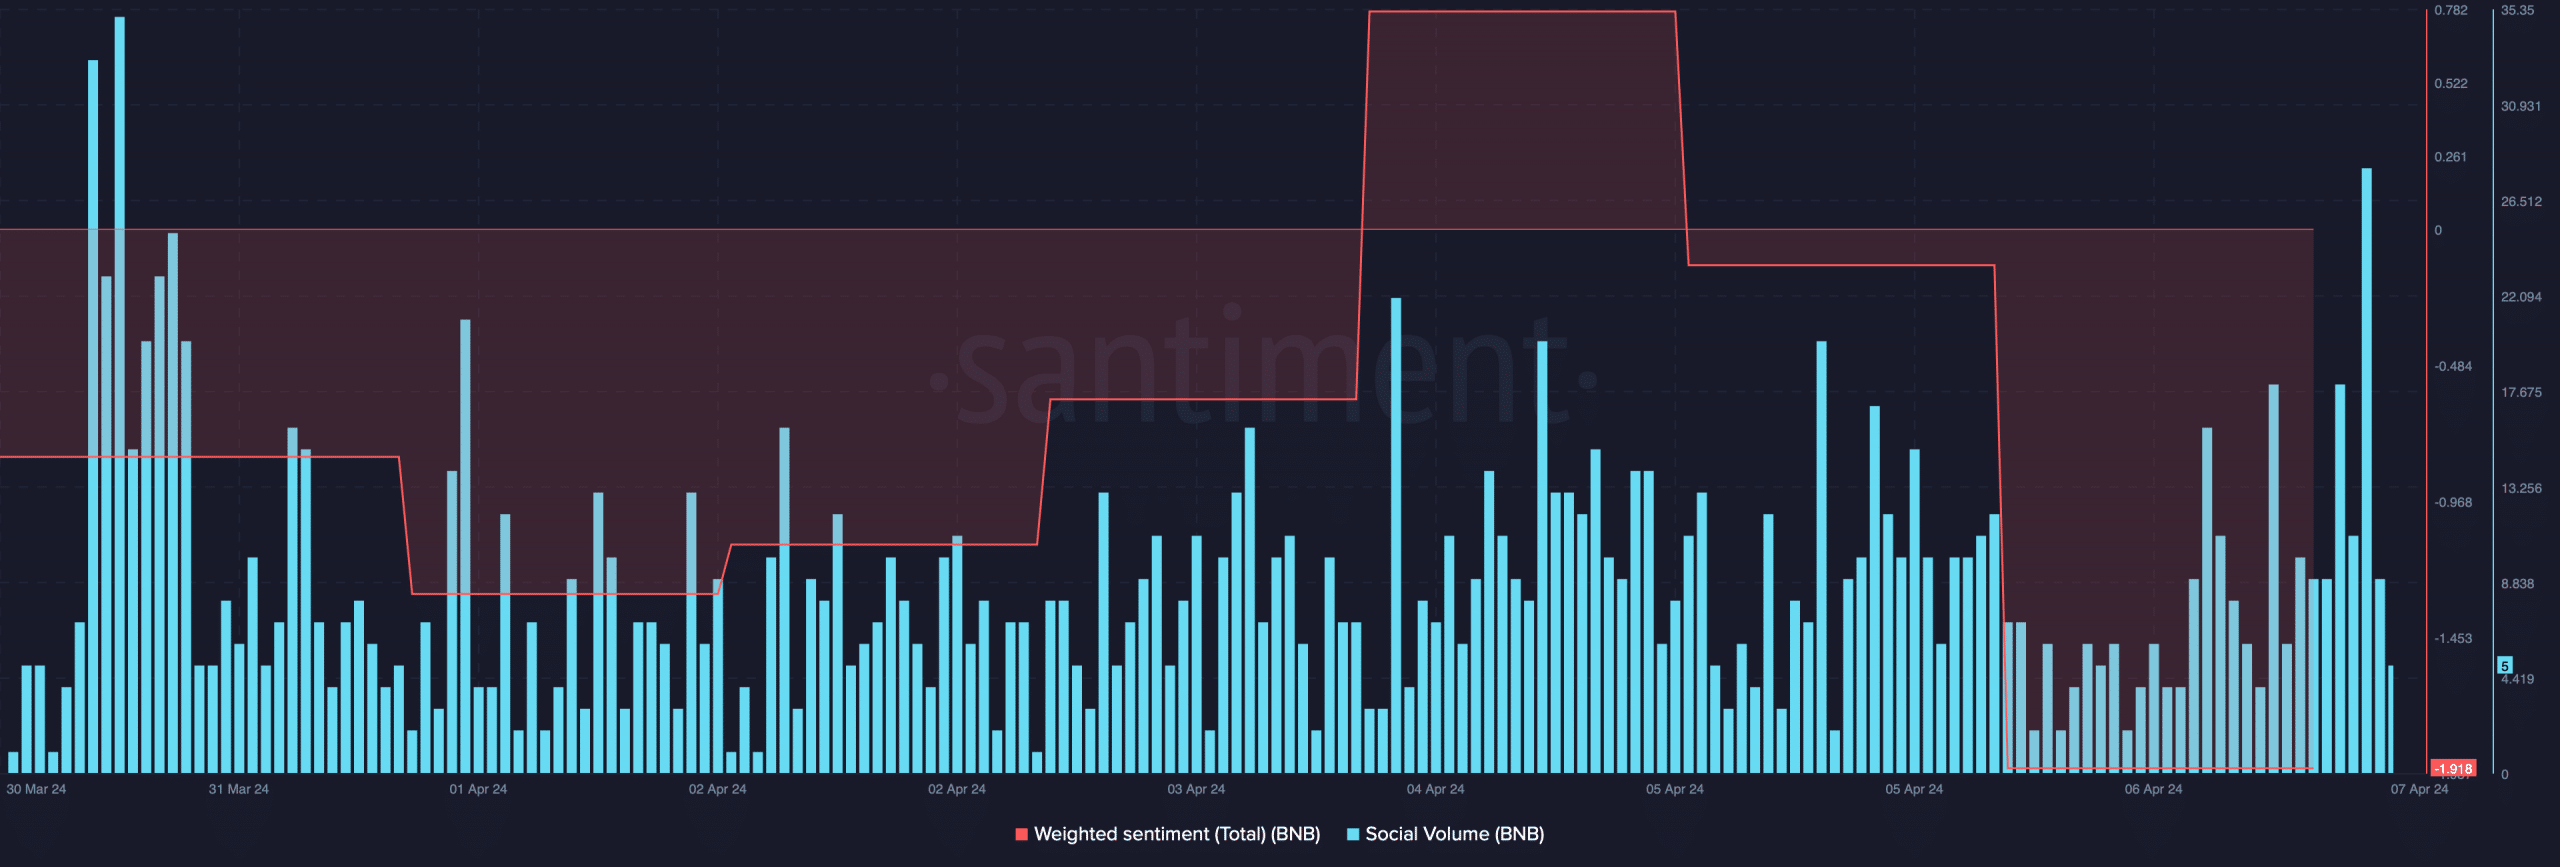
It was surprising to note that despite the rise in price, bearish sentiment around the coin remained dominant in the market as its Weighted Sentiment dropped.
However, its Social Volume spiked, reflecting its popularity in the crypto space.
Read Binance Coin’s [BNB] Price Prediction 2024-25
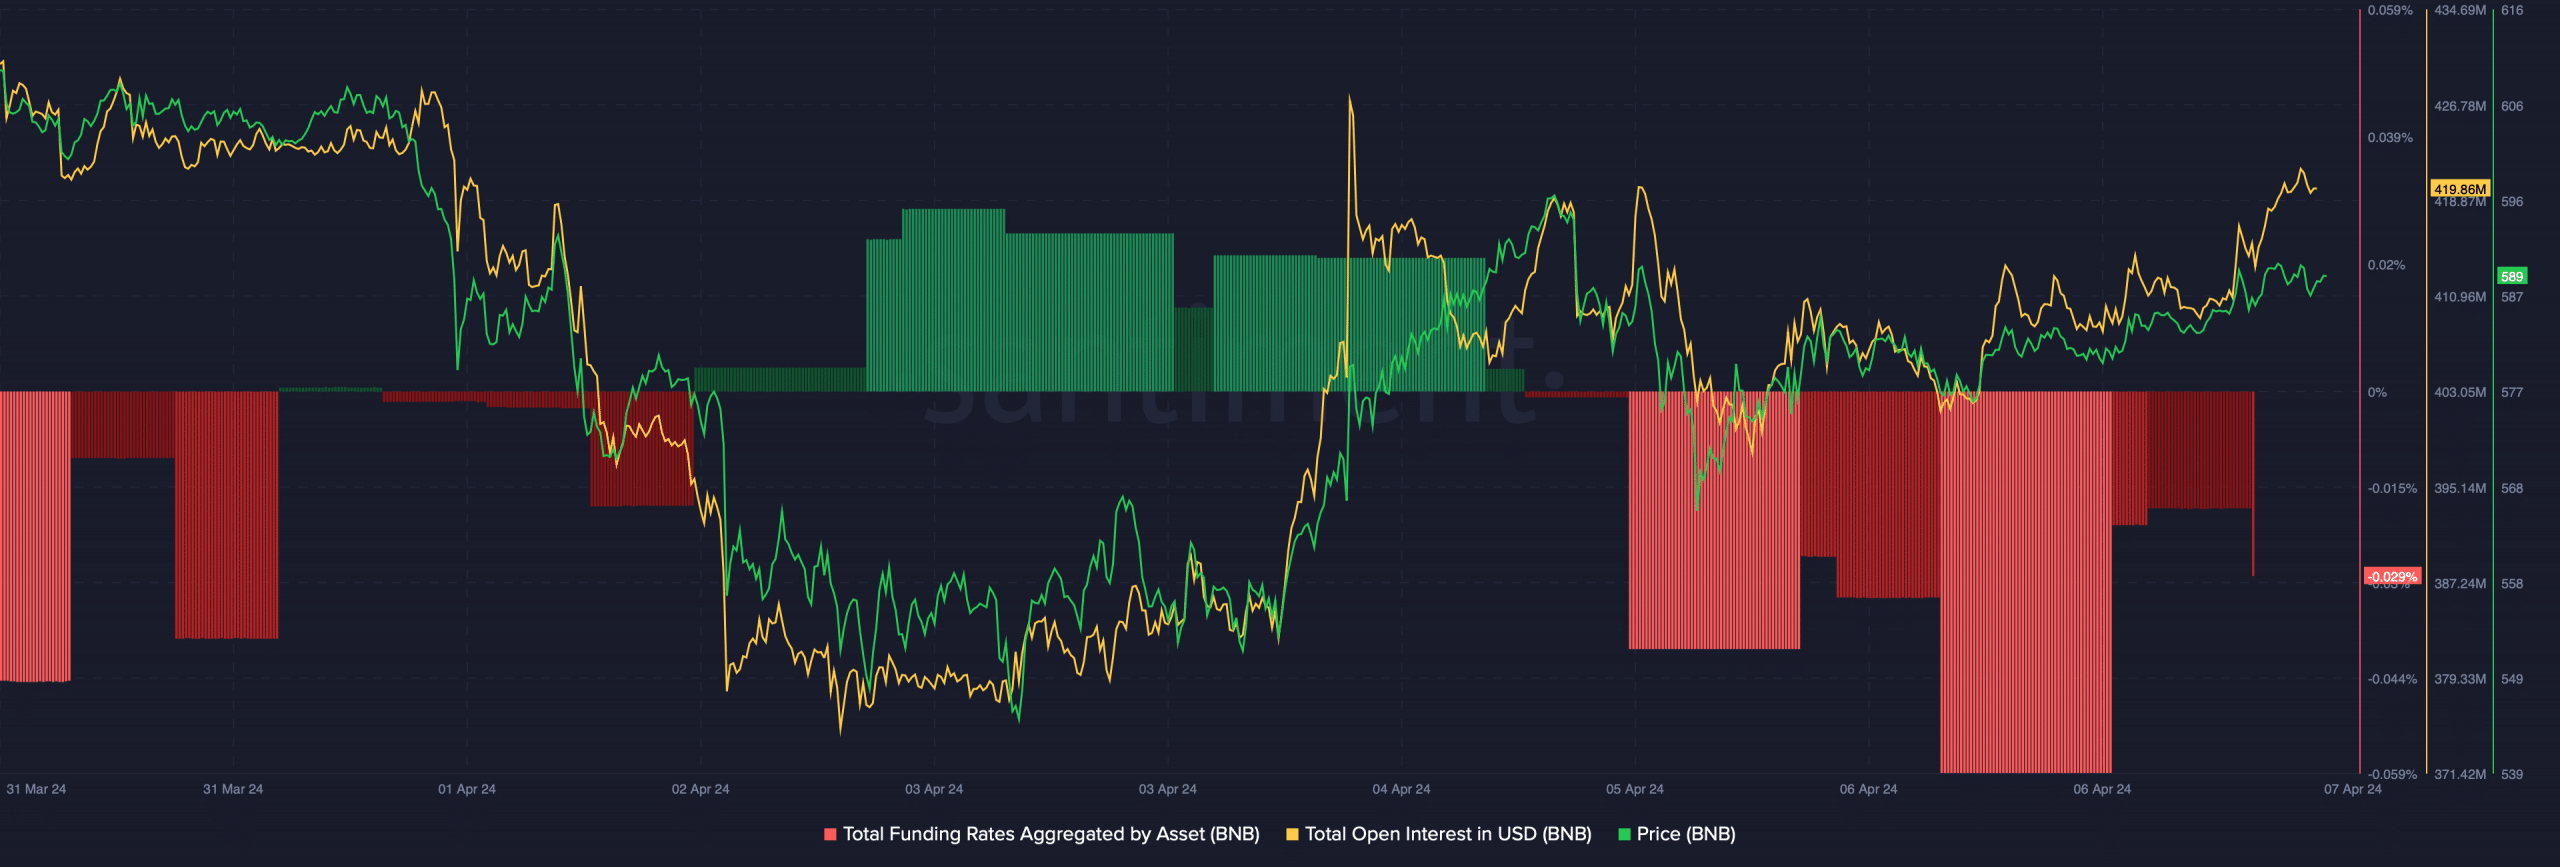
Things in the derivatives market also looked optimistic. For instance, Binance Coin’s Open Interest registered an uptick along with the price, indicating the current price trend will continue.
Generally, prices tend to move in a different direction than the Funding Rate. In this case, BNB’s Funding Rate dropped sharply, further suggesting a bull rally in the coming days.