BNB’s network usage and key metrics have something important for you
- The number of active users of BNB increased considerably last week.
- However, market indicators suggested a further price drop.
Token Terminal’s data revealed that Binance Coin’s [BNB] fees and revenue have been on a constant uptrend over the last few weeks. The credit for this can go to the average daily transactions conducted on the network.
Read Binance Coin’s [BNB] Price Prediction 2023-24
In this regard, one should note that BNB recently posted its weekly report, revealing that the average daily transaction exceeded 3.7 million.
Not only that, but BNB’s average weekly transactions also skyrocketed and reached 22.39 million.
Hmm, you're probably wondering what we've been up to this week. Luckily, we're wrapped it all up in our Weekly Ecosystem Report:
🔸Introducing the BNB Chain Innovation Roadshow
🔸BNB Chain Unveils Ecosystem Bounty Board
🔸ETH Denver Welcomes BNB Chainhttps://t.co/djZK8jiyjS— BNB Chain (@BNBCHAIN) March 5, 2023
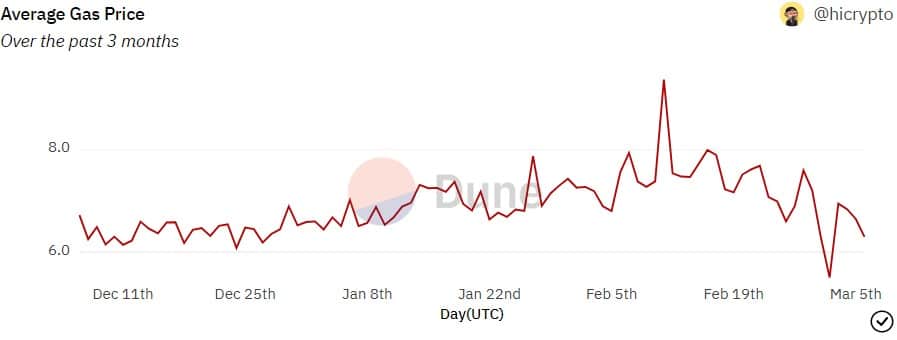
Interestingly, the average price of gas in the BNB chain has declined considerably since February. The decline in gas prices might have contributed to the considerable increase in the number of transactions over the past week.
User activity increases substantially
Apart from the number of transactions, another major uptick was noted in terms of BNB’s active users.
As per the weekly report, BNB’s weekly active users grew exponentially and reached 5.01 million. The same trend was also observed in the number of daily active users, which exceeded 1.3 million.
A possible reason for BNB’s growth could be the recent developments that happened in its ecosystem. The most notable one was the launch of BNB’s new Ecosystem Bounty Board.
The newly launched program gives the community the opportunity to both engage with and contribute to the development of the BNB Chain.
We're buzzing to announce the introduction of a NEW Ecosystem Bounty Board that gives our community the opportunity to both engage and contribute to the development of BNB Chain.https://t.co/vCVXGmbJKl
— BNB Chain (@BNBCHAIN) March 1, 2023
Is your portfolio green? Check the BNB Profit Calculator
NFTs are still struggling to move up
Despite growth in the aforementioned areas, BNB’s NFT marketplace’s performance was not satisfactory. Dune’s data revealed that both daily and monthly NFT volume registered declines, signifying less usage.
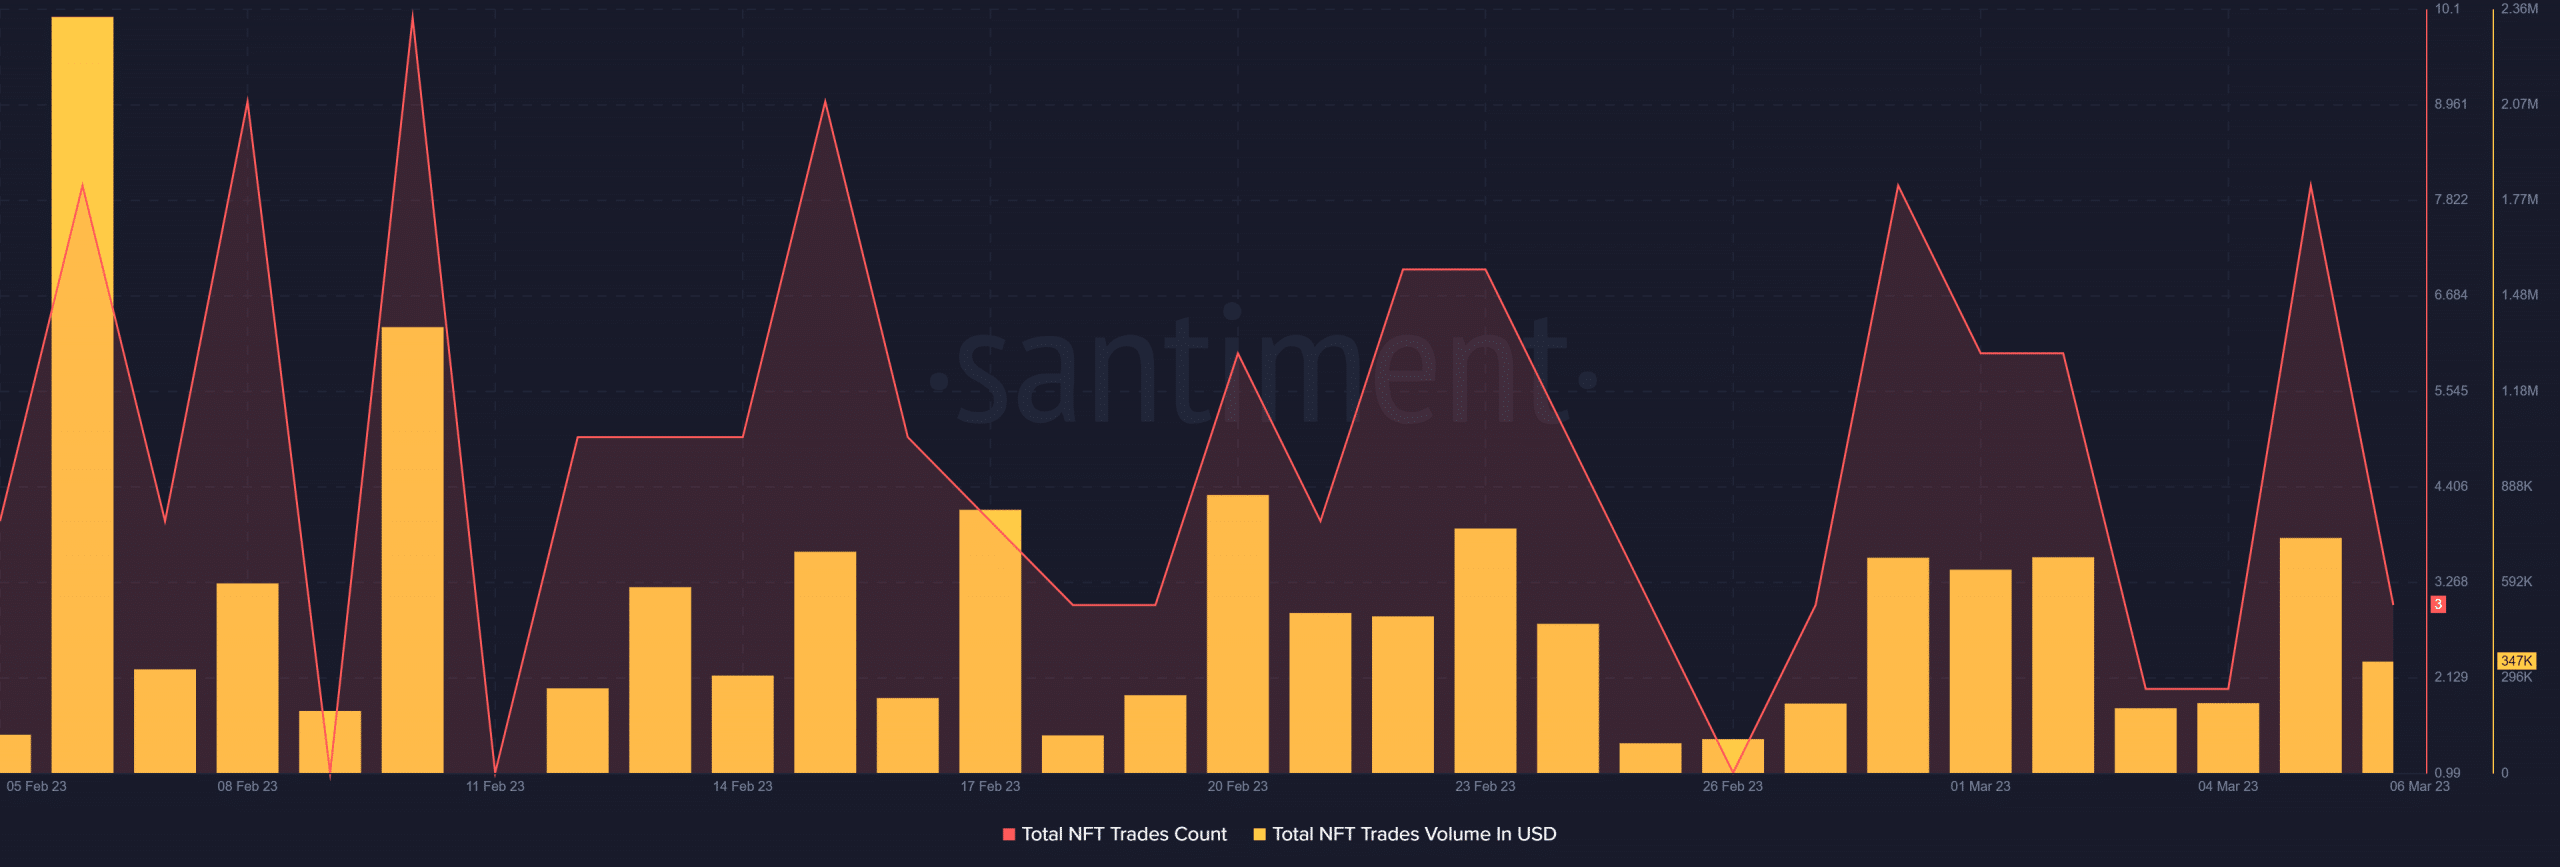
A similar trend was also pointed out by Santiment’s chart, as BNB’s total NFT trade counts and trade volume in USD declined over the last 30 days.
Should investors expect a bullish reaction?
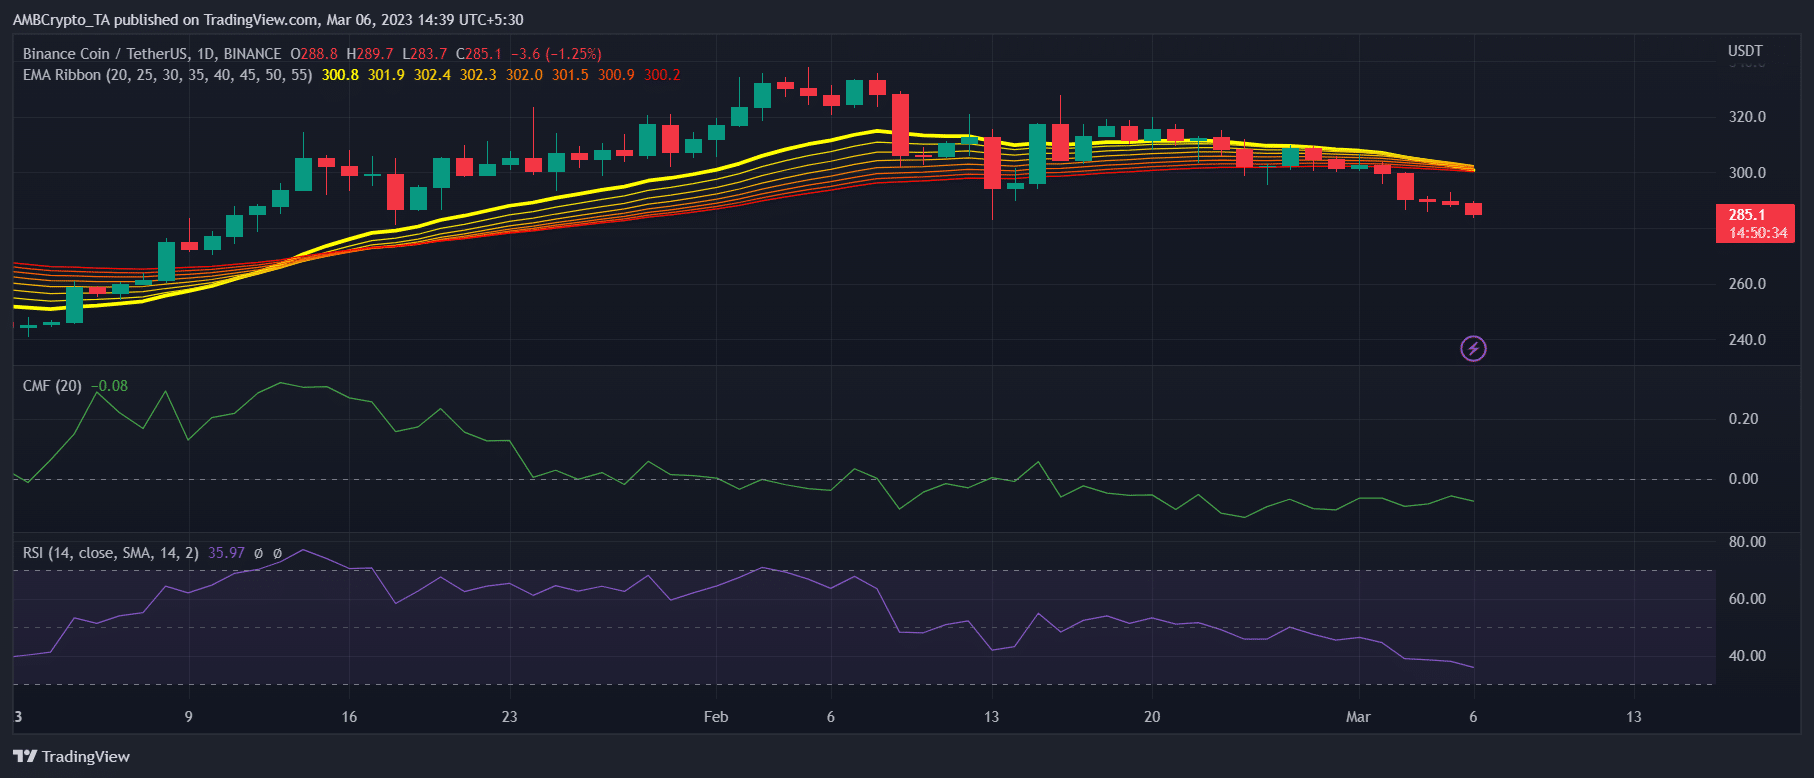
Though BNB Chain’s performance looked optimistic, the opposite was true for its price. A look at BNB’s daily chart revealed that the sellers were leading the market and might push BNB’s price further down.
For example, the Relative Strength Index (RSI) registered a downtick, which was bearish. BNB’s Chaikin Money Flow (CMF) also showed a similar pattern.
The Exponential Moving Average (EMA) Ribbon displayed the possibility of a bearish crossover, which was a concerning factor. At press time, BNB was down by 1.65% in the last 24 hours and was trading at $285.32.