Altcoin

BNB’s rocky road: Swings in volume, transactions, and price indicate that…
Posted:
Journalist

- Binance’s volume recently rebounded to over $600 million.
- BNB crossed over the neutral line as consecutive uptrends continued.
Binance recently encountered a significant amount of Fear, Uncertainty, and Doubt (FUD), primarily due to news surrounding the resignation of top executives from its US branch. This upheaval on the exchange appeared to impact its trading volume temporarily, but it has since shown signs of recovery. How have other critical metrics responded to these developments?
Read Binance Coin’s [BNB] Price prediction 2023-24
Binance sees swings in volume
According to Santiment data, the volume chart for Binance’s BNB token exhibited clear indications of a recent downtrend. The initial signs of this downtrend became evident around 13 September, as the volume plummeted from over $500 million to approximately $300 million. This downtrend coincided with reports of layoffs and the resignation of the CEO of Binance US.
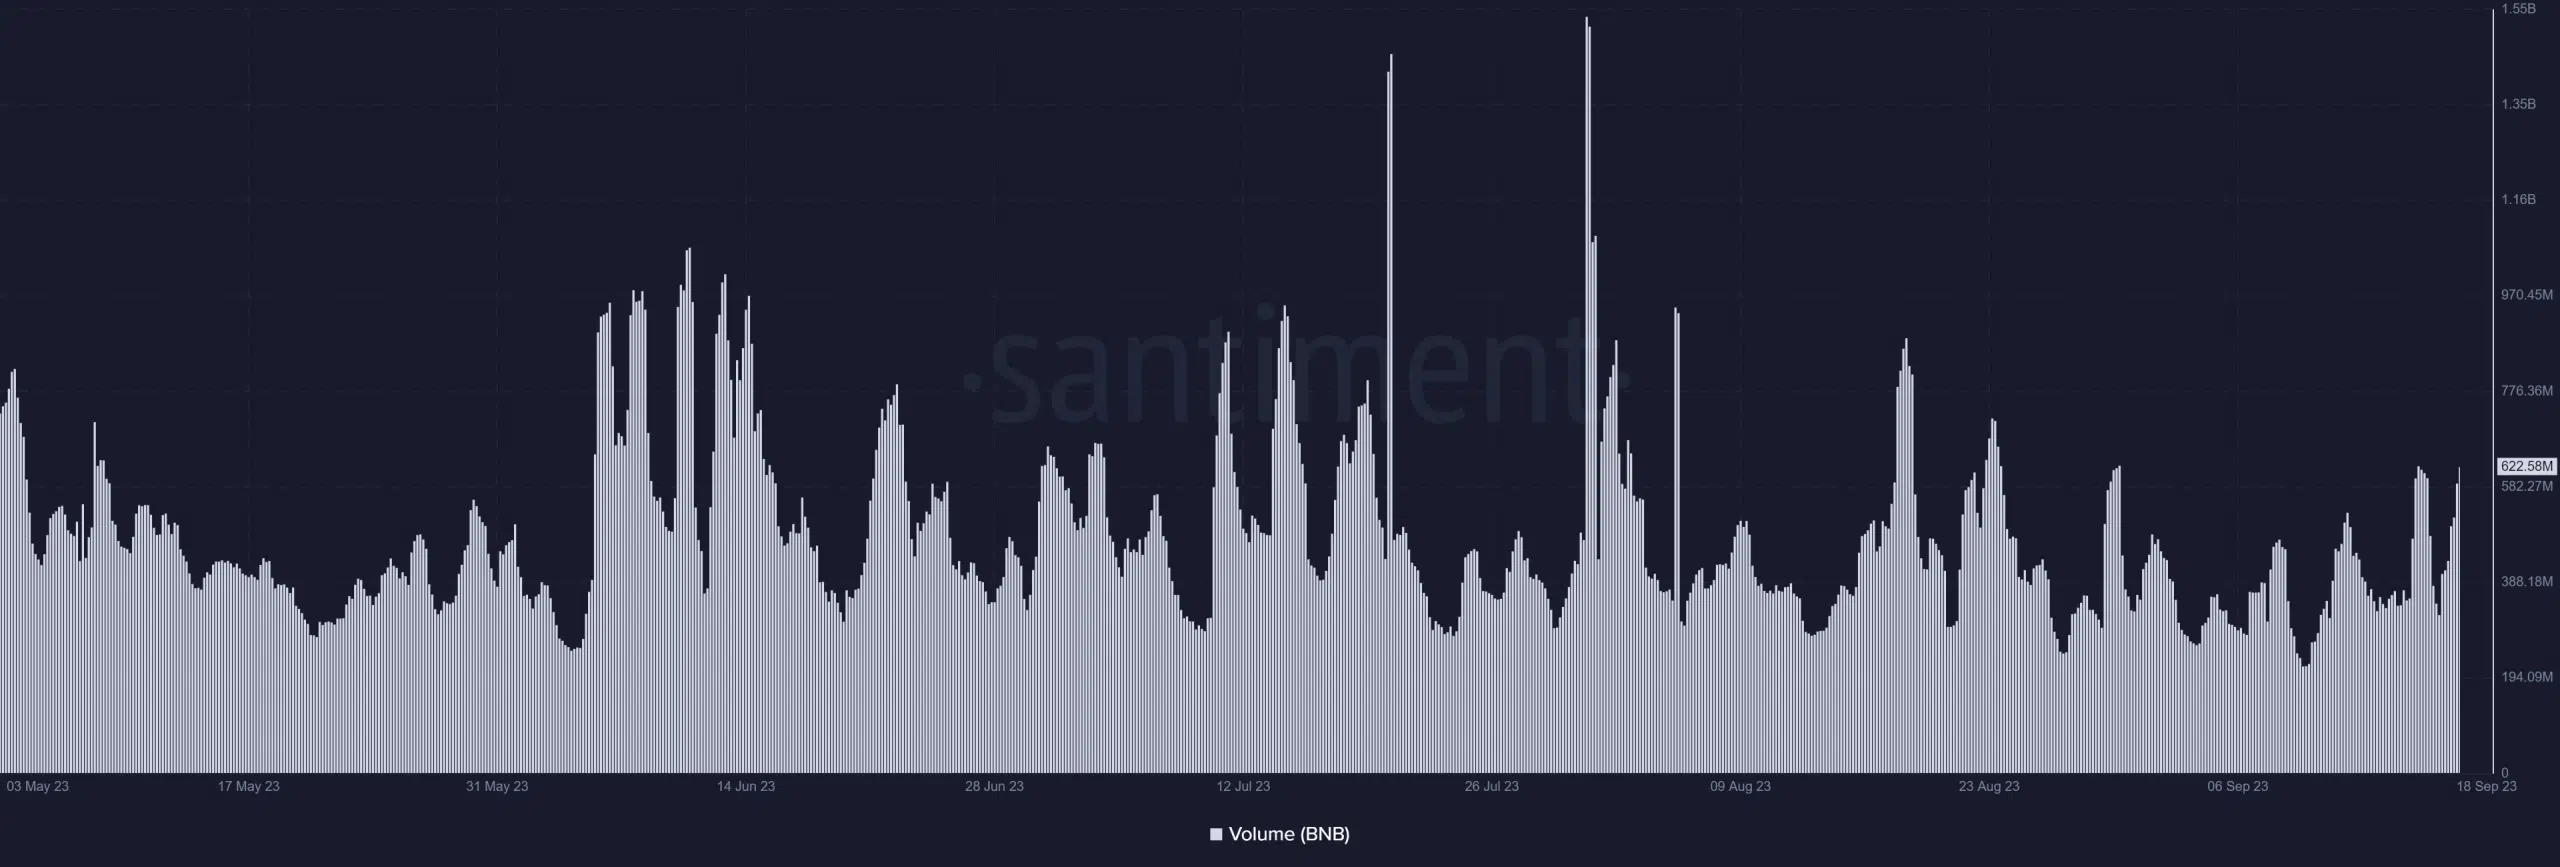
Source: Santiment
However, the volume experienced another upswing around 16 September, surpassing $600 million, only to decline again the next day. As of the time of writing, the volume had rebounded, exceeding $622 million.
Monitoring transactions on the smart chain
An examination of Binance’s transaction volume on DefiLlama revealed a noticeable decrease in the number of transactions occurring on the chain. An analysis of the transaction trend demonstrated that Binance kicked off the year with robust activity but experienced a downturn starting around May. Prior to this decline, the average transaction size exceeded $4 million. However, as of the current moment, the transaction volume dwindled to approximately $3 million.
Furthermore, there has been a decrease in the stablecoin market cap within the network, signaling a reduction in liquidity. At the beginning of the year, the stablecoin market cap surpassed $9 billion but has since contracted to around $5 billion as of this writing.
BNB continues its renewed uptrend
Analyzing the daily price trend of Binance Coin (BNB) revealed a recent uptick. The chart indicated that BNB consistently witnessed a series of minor uptrends, each of which was less than 1%, spanning the past three days. At the time of writing, BNB was trading at approximately $219, boasting a price increase of over 1%.
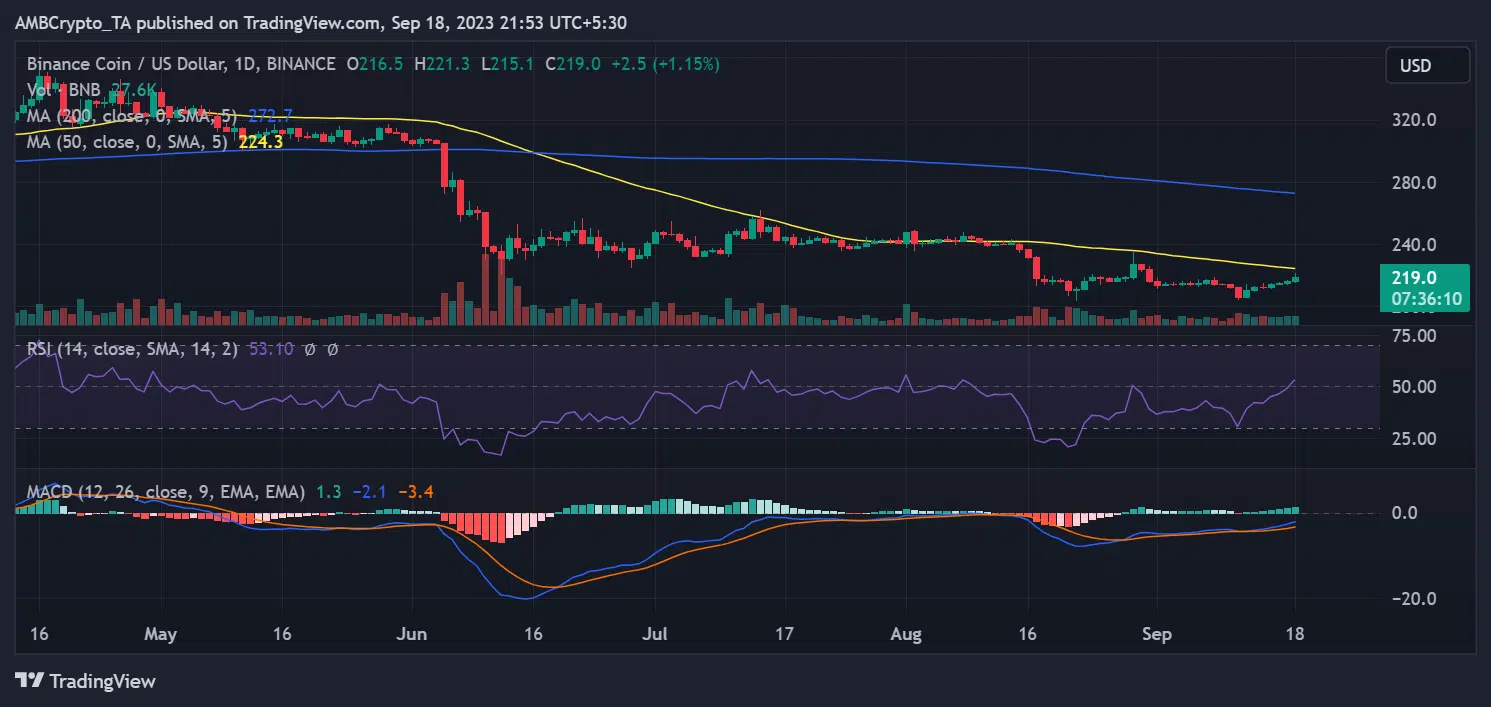
Source: TradingView
– How much are 1,10,100 BNBs worth today
Furthermore, this uptrend has propelled BNB above the neutral line on its Relative Strength Index (RSI), suggesting a mild bullish trend. Moreover, there’s the potential for BNB to cross over its short-term Moving Average (depicted by the yellow line) if this uptrend continues.