
- BOME’s price has risen by double digits in the last 24 hours
- Last few weeks have seen it consolidate within a horizontal channel too
The recent surge in the memecoin market has contributed to the frog-themed token Book of Meme [BOME] recording a 21% price hike in the last 24 hours.
At press time, the altcoin was valued at $0.0125 on the charts. During the early trading hours of 16 May, BOME’s price rallied to a one-month high of $0.13, before a slight drawback to its press time level, according to CoinMarketCap.
BOME makes an attempt
The lull in the crypto-market before the recent uptrend caused BOME’s price to trade within a narrow range, forming a horizontal channel.
This channel is typically formed when an asset trades sideways within a specific range over a given period of time. This occurs when neither the asset’s buyers nor sellers have a strong enough influence to push the price significantly up or down. In this situation, a zone is created where the asset’s price bounces between a high and a low, which forms its resistance and support levels.
In BOME’s case, it has faced resistance at $0.0127, while finding support at $0.007.
At the time of writing, BOME appeared poised to trade above its resistance level. A buy signal is generated when an asset’s price breaks above the upper resistance trend line.
AMBCrypto’s assessments of other key technical indicators confirmed the possibility of a breach above this resistance level.
For example, BOME’s key momentum indicators were spotted in uptrends at press time. Its Relative Strength Index (RSI) was 58.38, while its Money Flow Index (MFI) was 61.95.
At these values, these indicators revealed that buying pressure exceeded profit-taking activity.
Furthermore, BOME’s Chaikin Money Flow (CMF) rallied above its zero line to post a value of 0.03 at press time. This indicator tracks the flow of money into and out of an asset. When it returns a value above zero, the market is being supplied with the liquidity needed to sustain an asset’s price.
Also, BOME’s Elder-Ray Index returned a positive value, confirming the ongoing bullish trend. This indicator measures the relationship between the strength of the altcoin’s buyers and sellers in the market.
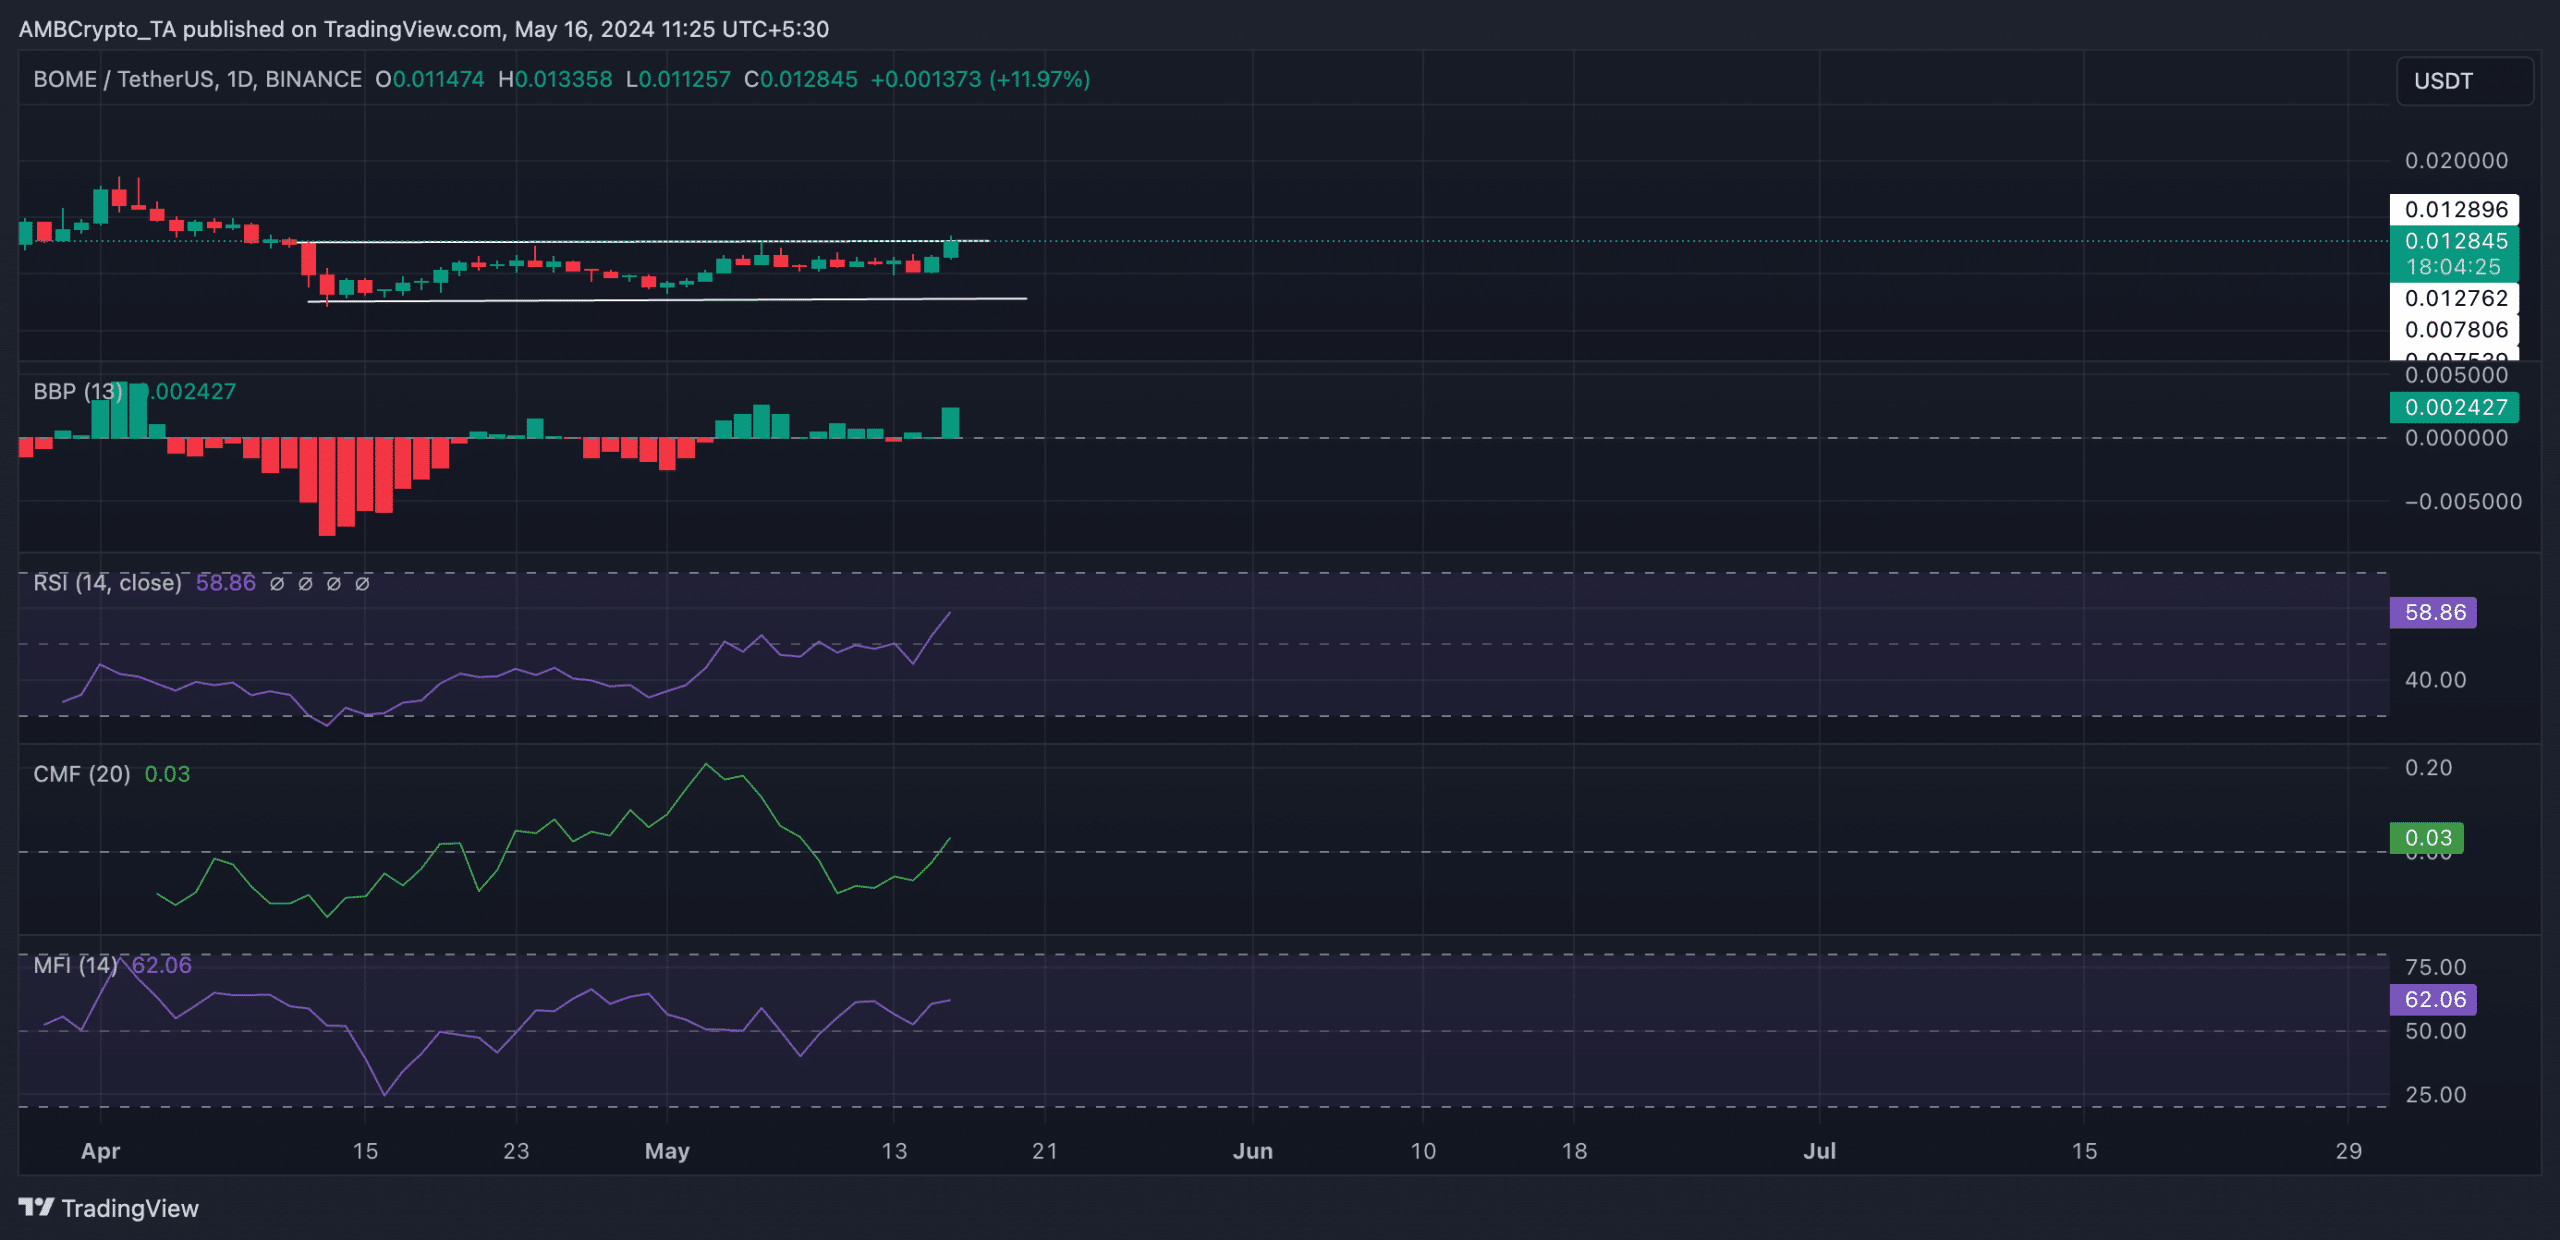
Source: BOME/USDT on TradingView
When it is positive like this, bullish control dominates the market. At press time, BOME’s Elder-Ray Index was 0.0024.
Read Book of MEME’s [BOME] Price Prediction 2024-25
What next for BOME?
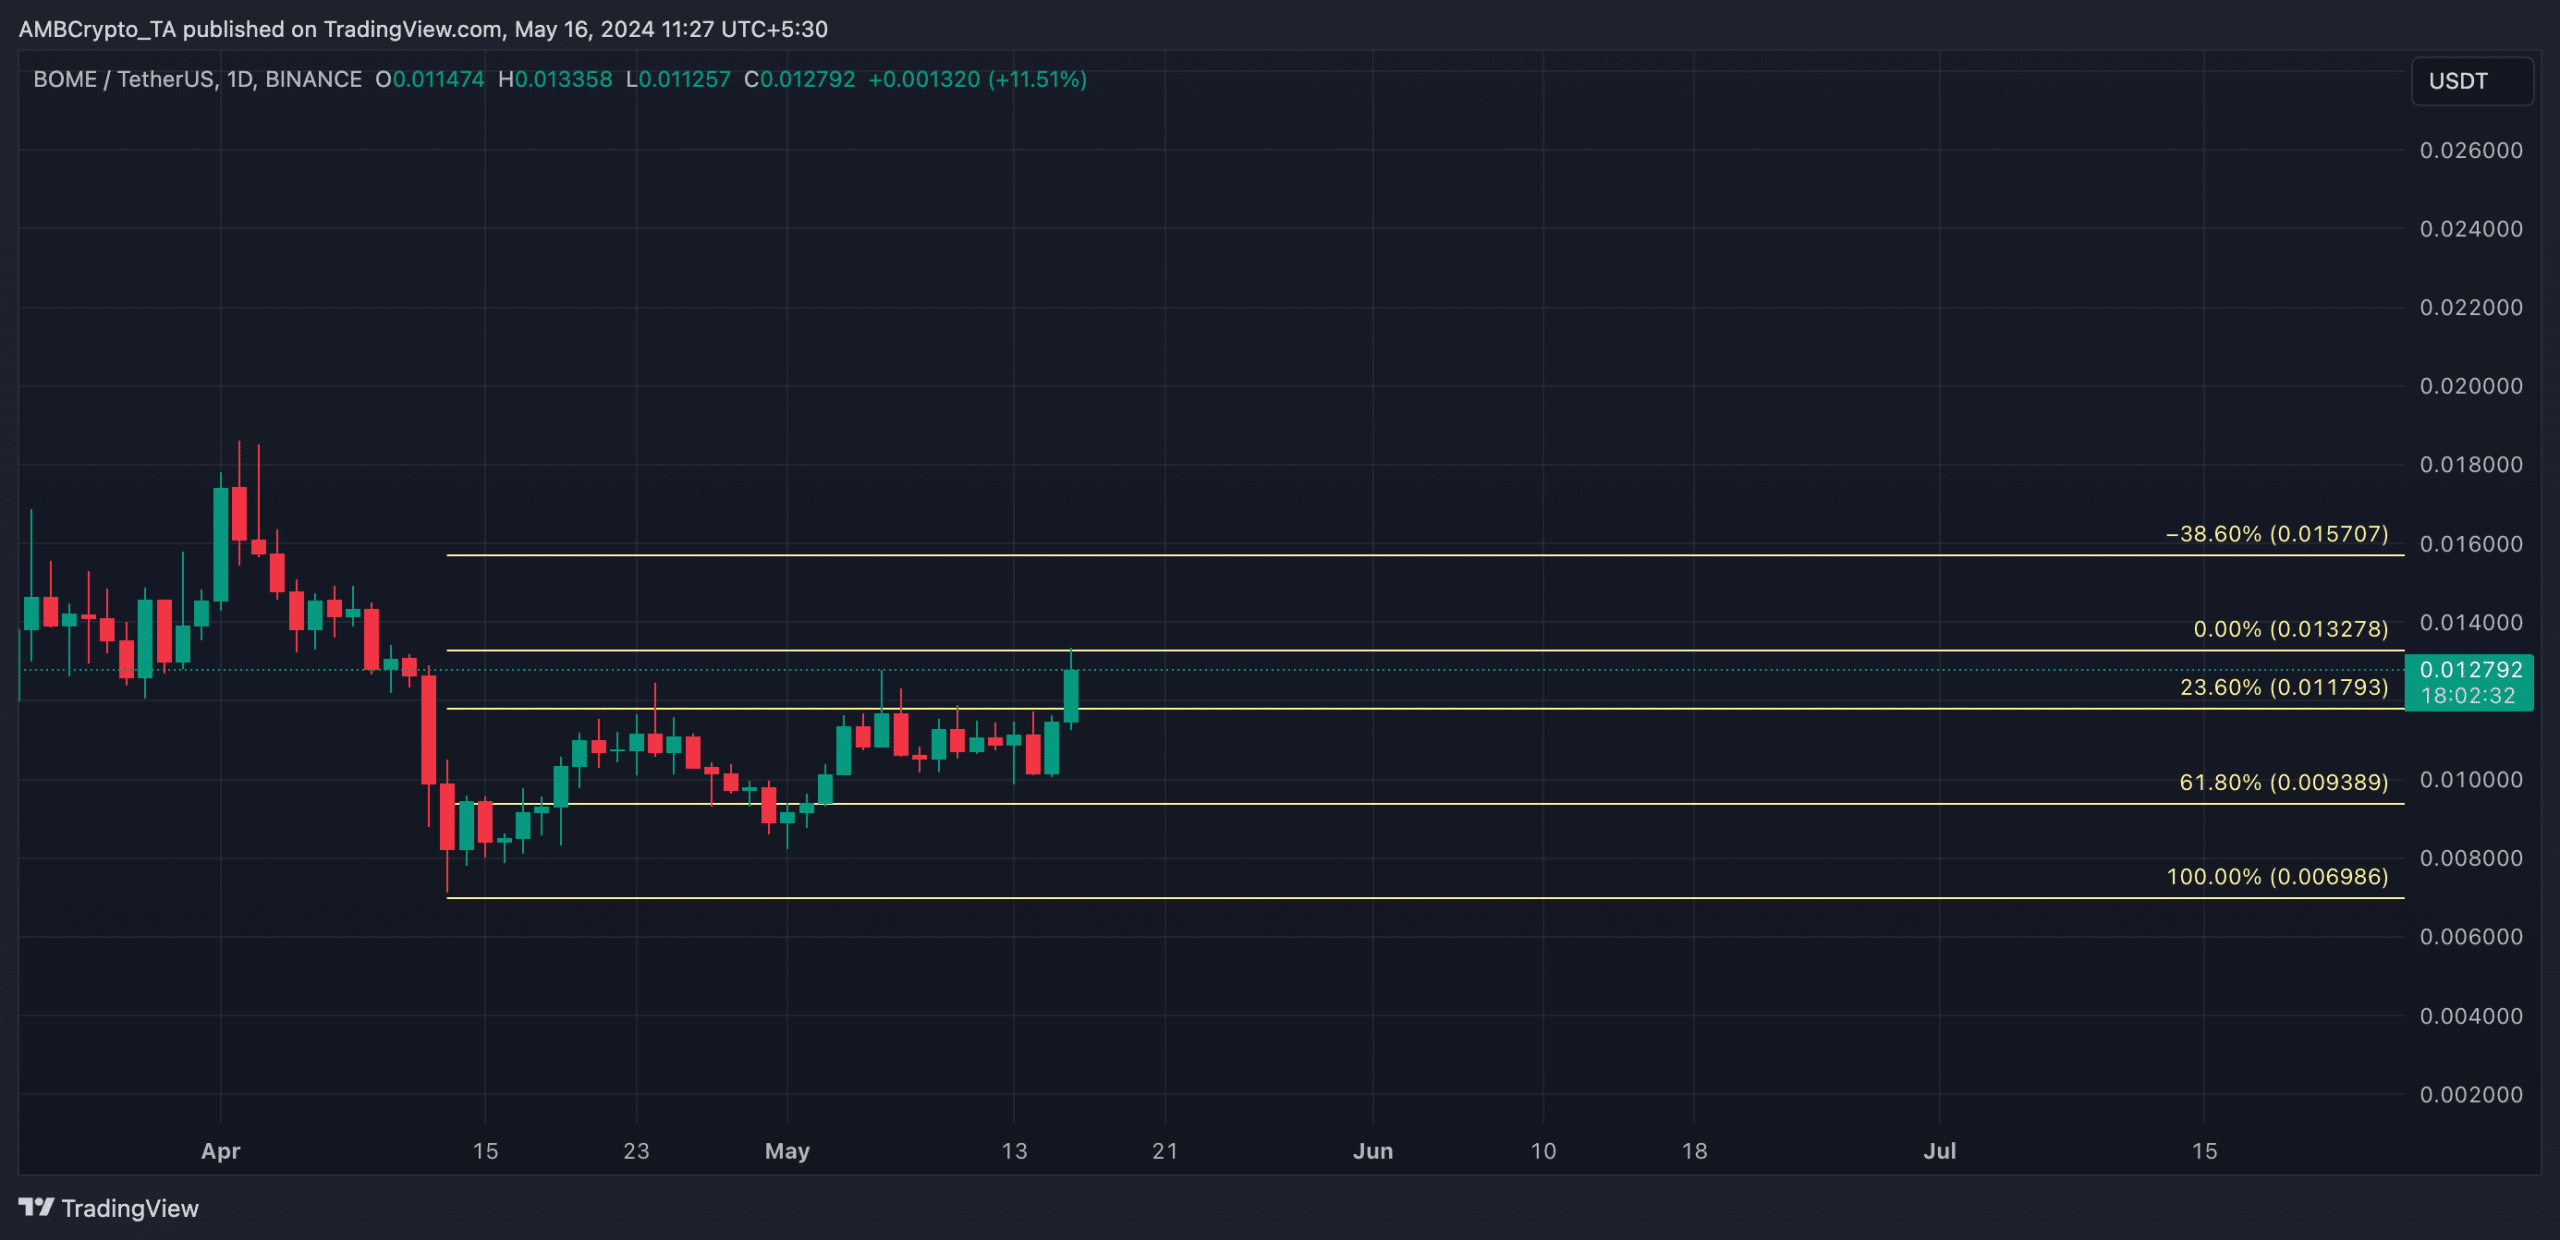
Source: BOME/USDT on TradingView
If BOME breaks above its resistance, its next price point will be $0.015. However, if this projection is invalidated and the bears regain control, the memecoin’s value might be forced towards its support at $0.009.