BONK: Explaining 40% weekly fall and if these indicators mean something
BONK’s market sentiment grows poorer as memecoin’s price chases new lows.
- BONK’s price has fallen by double digits in the last week.
- Key indicators suggest the possibility of a further decrease.
Solana-based memecoin Bonk [BONK] has extended its losses to rank as the second asset with the most decline in the last week, according to CoinMarketCap data.
In the last seven days, the memecoin’s price has fallen by over 40%, making it the leading meme asset with the most decline during that period.
BONK eyes more losses
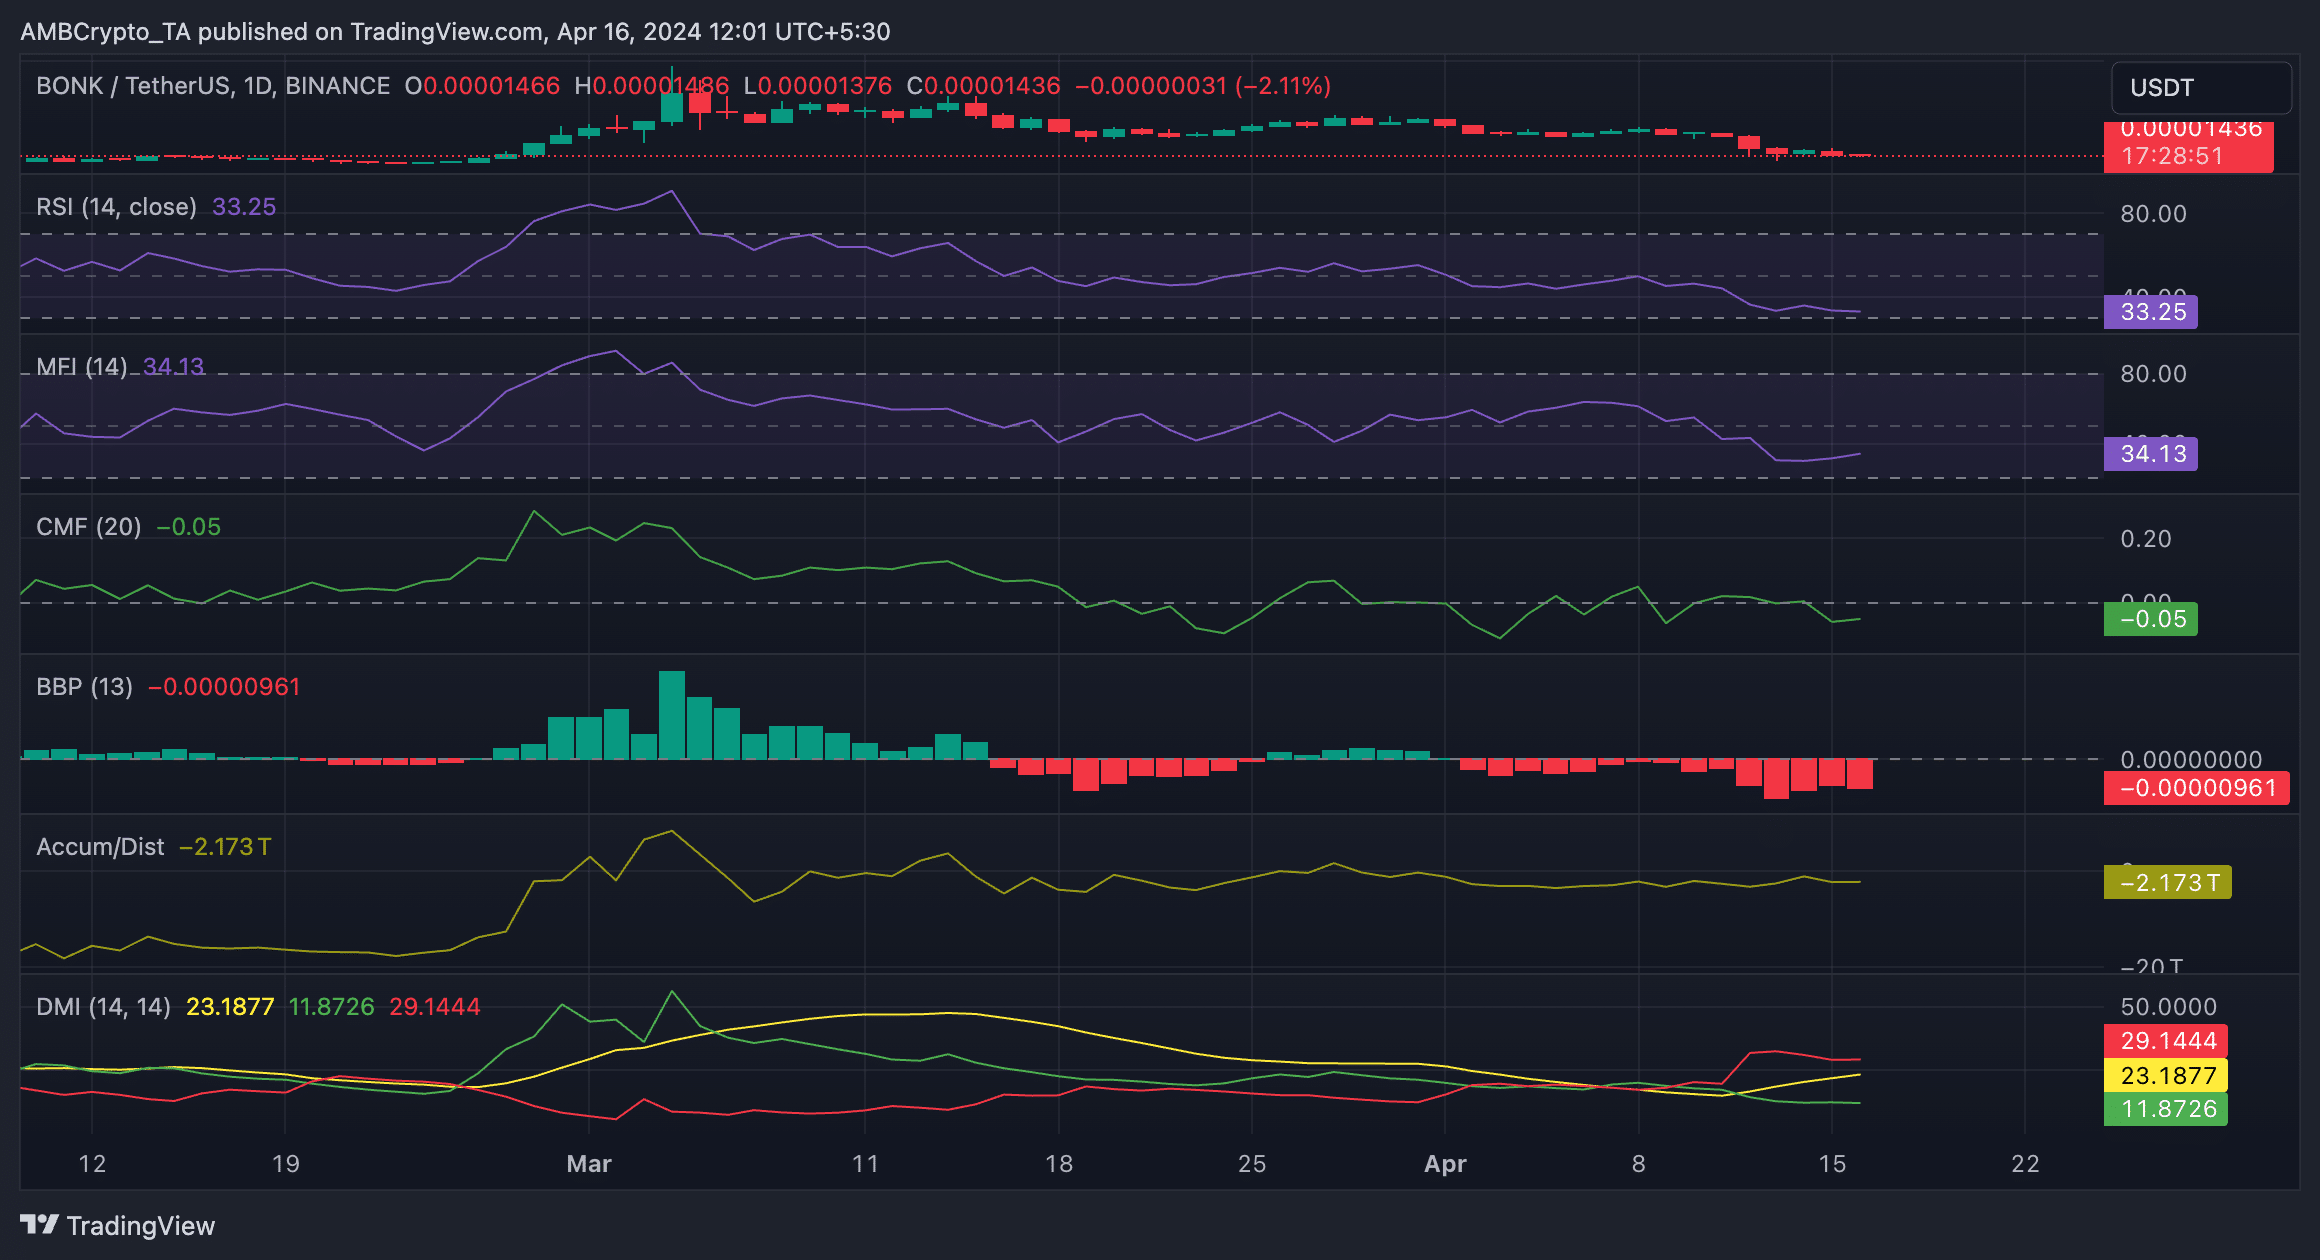
As of this writing, BONK traded at $0.000014. An assessment of the altcoin’s price movements on a daily chart confirmed the possibility of a further decline.
Firstly, its Chaikin Money Flow (CMF) trended downward and was spotted below the zero line. This indicator measures money flow into and out of the BONK market.
When it returns a negative value, it is interpreted as a sign of market weakness, as market participants remove liquidity from the market. BONK’s CMF was -0.05.
Further, the downward slope of its Accumulation/Distribution Line (ADL) showed that BONK had witnessed a significant decline in demand in the past few weeks.
This indicator also gauges the flow of money into or out of an asset over a specified period of time. When it declines this way, it shows that less money is flowing into the asset and that selling pressure is gaining momentum.
Confirming the decline in BONK’s buying pressure, its key momentum indicators were spotted near oversold zones at press time. For example, the meme coin’s Relative Strength Index (RSI) was 33.25, while its Money Flow Index (MFI) was 34.13.
At these values, these indicators showed that market participants favored BONK distribution over accumulation.
Additionally, the token’s positive directional index (green) rested below its negative index (red), signaling a significant bearish sentiment.
When readings from an asset’s Directional Movement Index (DMI) reveal this, it is a sign that asset holders are selling more than they are buying.
Is your portfolio green? Check the Bonk Profit Calculator
BONK’s Elder-Ray Index confirmed the market’s bearish sentiment. This indicator measures the relationship between the strength of buyers and sellers in the market.
When it returns a negative value, selling activity increases as bear power becomes more significant.