
- BONK’s open interest is at its lowest level in the last month.
- Key technical indicators hint at the possibility of a further decline in BONK’s value.
Dog-themed Solana-based meme coin Bonk [BONK] has shed 29% of its value in the last week as its futures open interest drops to a 30-day low.
According to CoinMarketCap’s data, BONK exchanged hands at $0.0000233 at press time and was ranked the cryptocurrency asset with the most losses in the last seven days.
The altcoin’s price decline is attributable to the drop in its futures open interest to its lowest level in a month. Per Coinglass’ data, BONK’s open interest initiated a decline on 5th March and has since dropped by 60%.
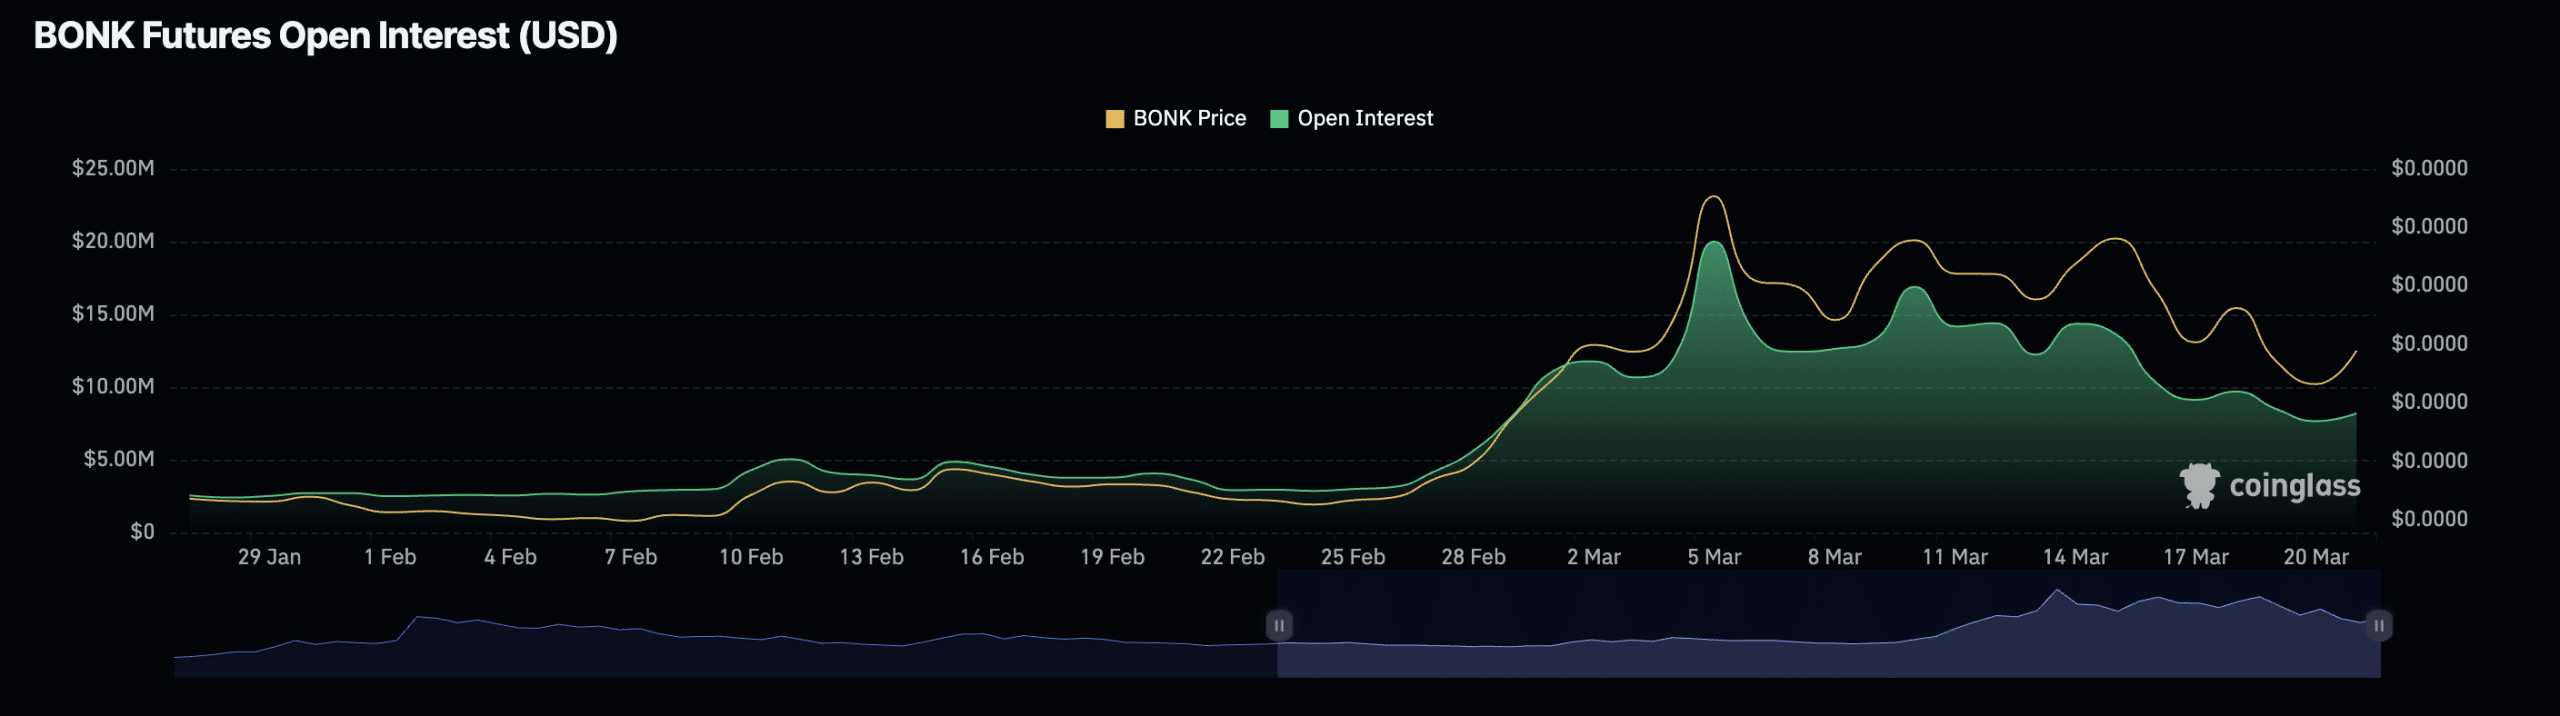
Source: Coinglass
When an asset’s open interest decreases, it suggests reduced interest or participation from traders in the derivative market for that asset. This is often a result of a shift in investor sentiment and increased profit-taking or attempts to cut losses.
More troubles lie ahead for BONK
The last week has seen the values of leading meme assets decline as the hype around them begins to wane. Regarding BONK, its weighted sentiment turned negative on 16th March and has since posted values below zero.
A negative weighted sentiment indicates a prevailing bearish outlook among market participants and often results in a further decline in an asset’s value.
AMBCrypto assessed BONK’s price performance, and the key technical indicators assessed confirmed the presence of bearish sentiments. For example, the meme coin’s Aroon Down Line (blue) observed on a 24-hour chart was 85.71%.
This indicator is used to identify trend strength and potential trend reversal points in a crypto asset’s price movement. When the Aroon Down line is close to 100, it indicates that the downtrend in the market is strong and that the most recent low was reached relatively recently.
Is your portfolio green? Check the Bonk Profit Calculator
Further, BONK’s Chaikin Money Flow (CMF) was -0.03 at press time. A CMF value below zero is a sign of weakness in the market. It suggests a decline in liquidity inflow, often resulting in a continuous fall in an asset’s value.
Additionally, BONK’s Relative Strength Index (RSI) revealed the decline in demand for the meme coin among its spot market participants. As of this writing, BONK’s RSI was 48.04, signaling that investors preferred to sell their holdings rather than buy more.
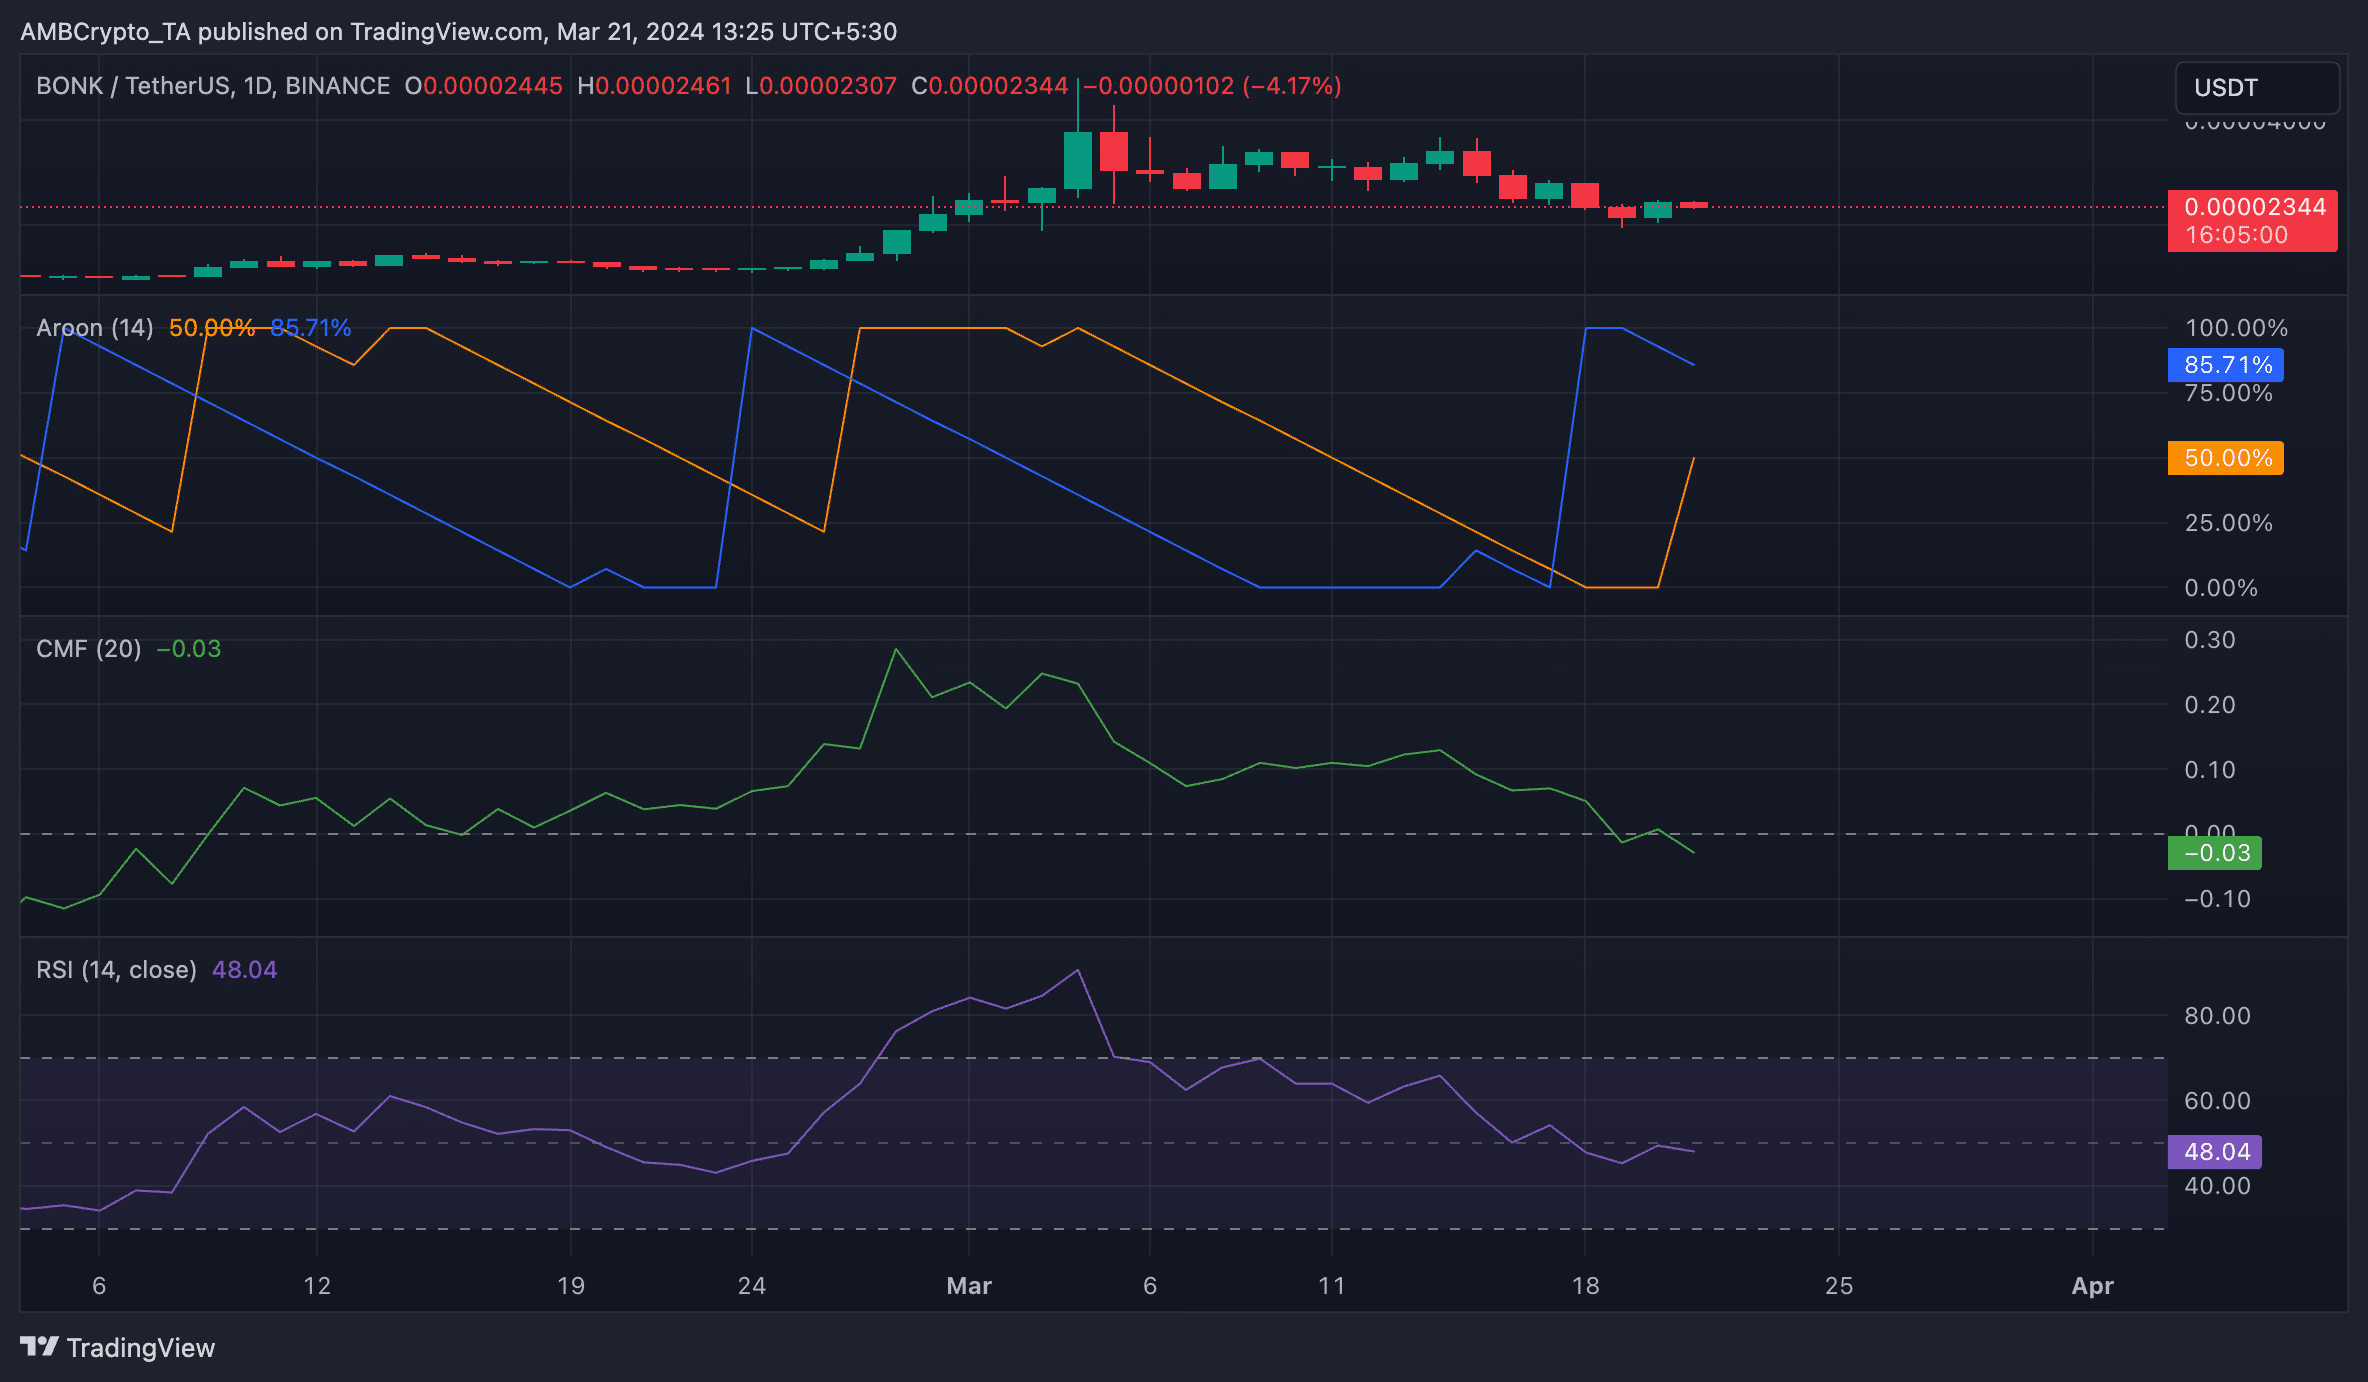
Source: TradingView