- BONK saw signs of a bullish reversal at a key support level
- Metric underlined growing interest and potential bullish momentum on the charts
BONK’s price has been a rollercoaster ride lately, with significant highs and lows. In fact, the altcoin’s price has depreciated by 47% since 28 May. At the time of writing, it was close to a crucial support level at around $0.00002260, having retested it several times in the last 3 months.
The price seemed to be obeying an ascending trendline support too, one that confluences with $0.00002206. It would thus seem that BONK may have been accumulating bullish momentum, probably to the next resistance level at $0.00002940, before breaking free as it accumulates enough momentum to breach its resistance level.
At the time of writing, BONK’s market cap had a valuation of $297 million, with the altcoin losing over 3% of its value in the last 24 hours alone.
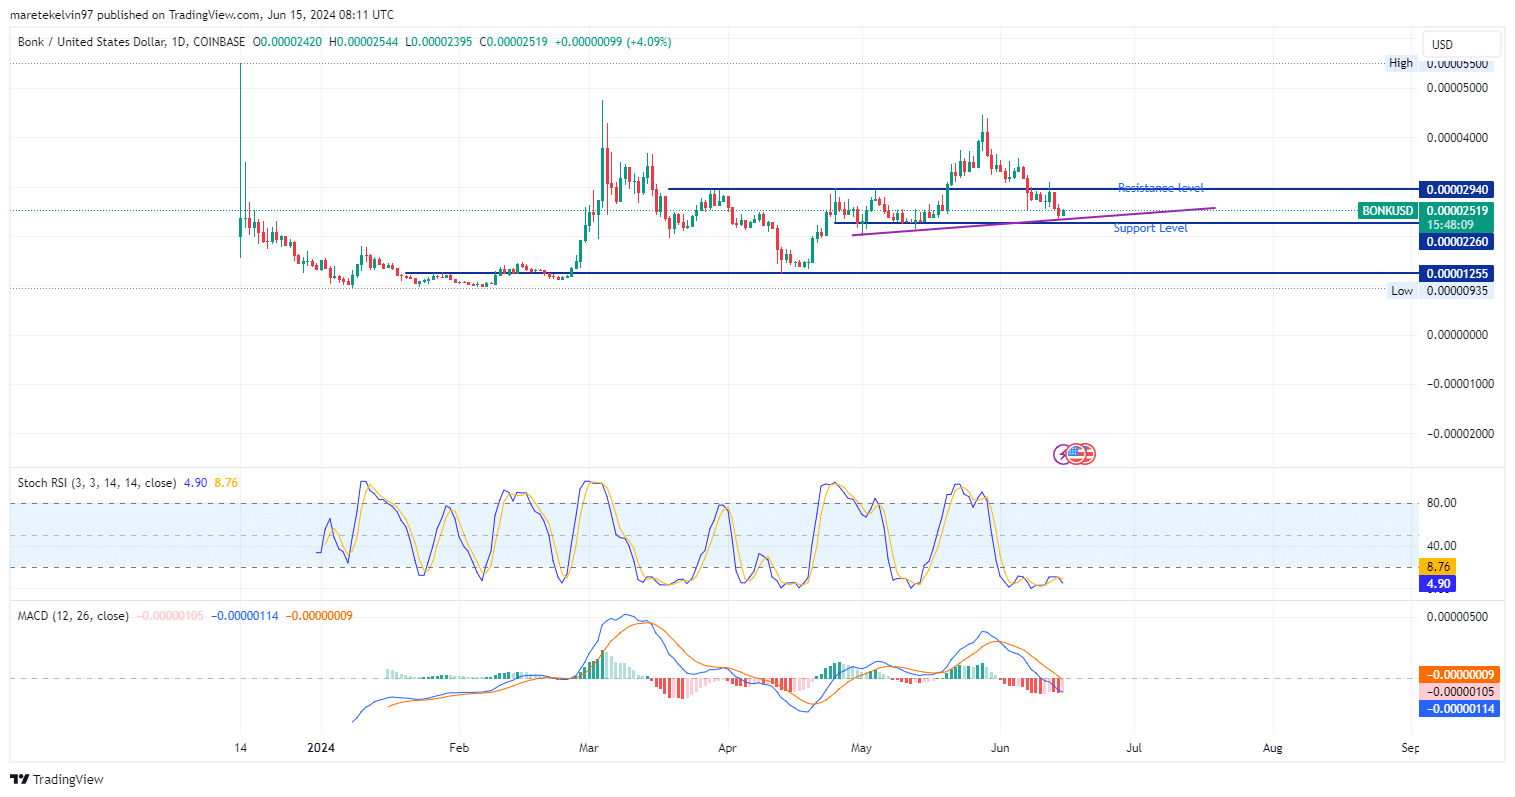
Source: BONK/USD, TradingView
On the chart, the stochastic RSI (4.90) indicated that BONK was in an oversold zone, suggesting a buying opportunity after a likely reversal.
Furthermore, the moving average convergence divergence – With a close line at -0.00000009 – pointed to a potential convergence, one hinting at a shift in bearish momentum to bullish momentum.
What tale do the metrics tell?
AMBCrypto’s analysis of Santiment’s data revealed some notable trends. For example – The percentage of stablecoin total supply held by whales with more than $5 million registered an ascending trend. This trend is a sign of reinforced confidence among large holders, which can precede impending price movements.
As BONK whales accumulate, the market’s buying pressure could increase, pushing the prices higher in the process.
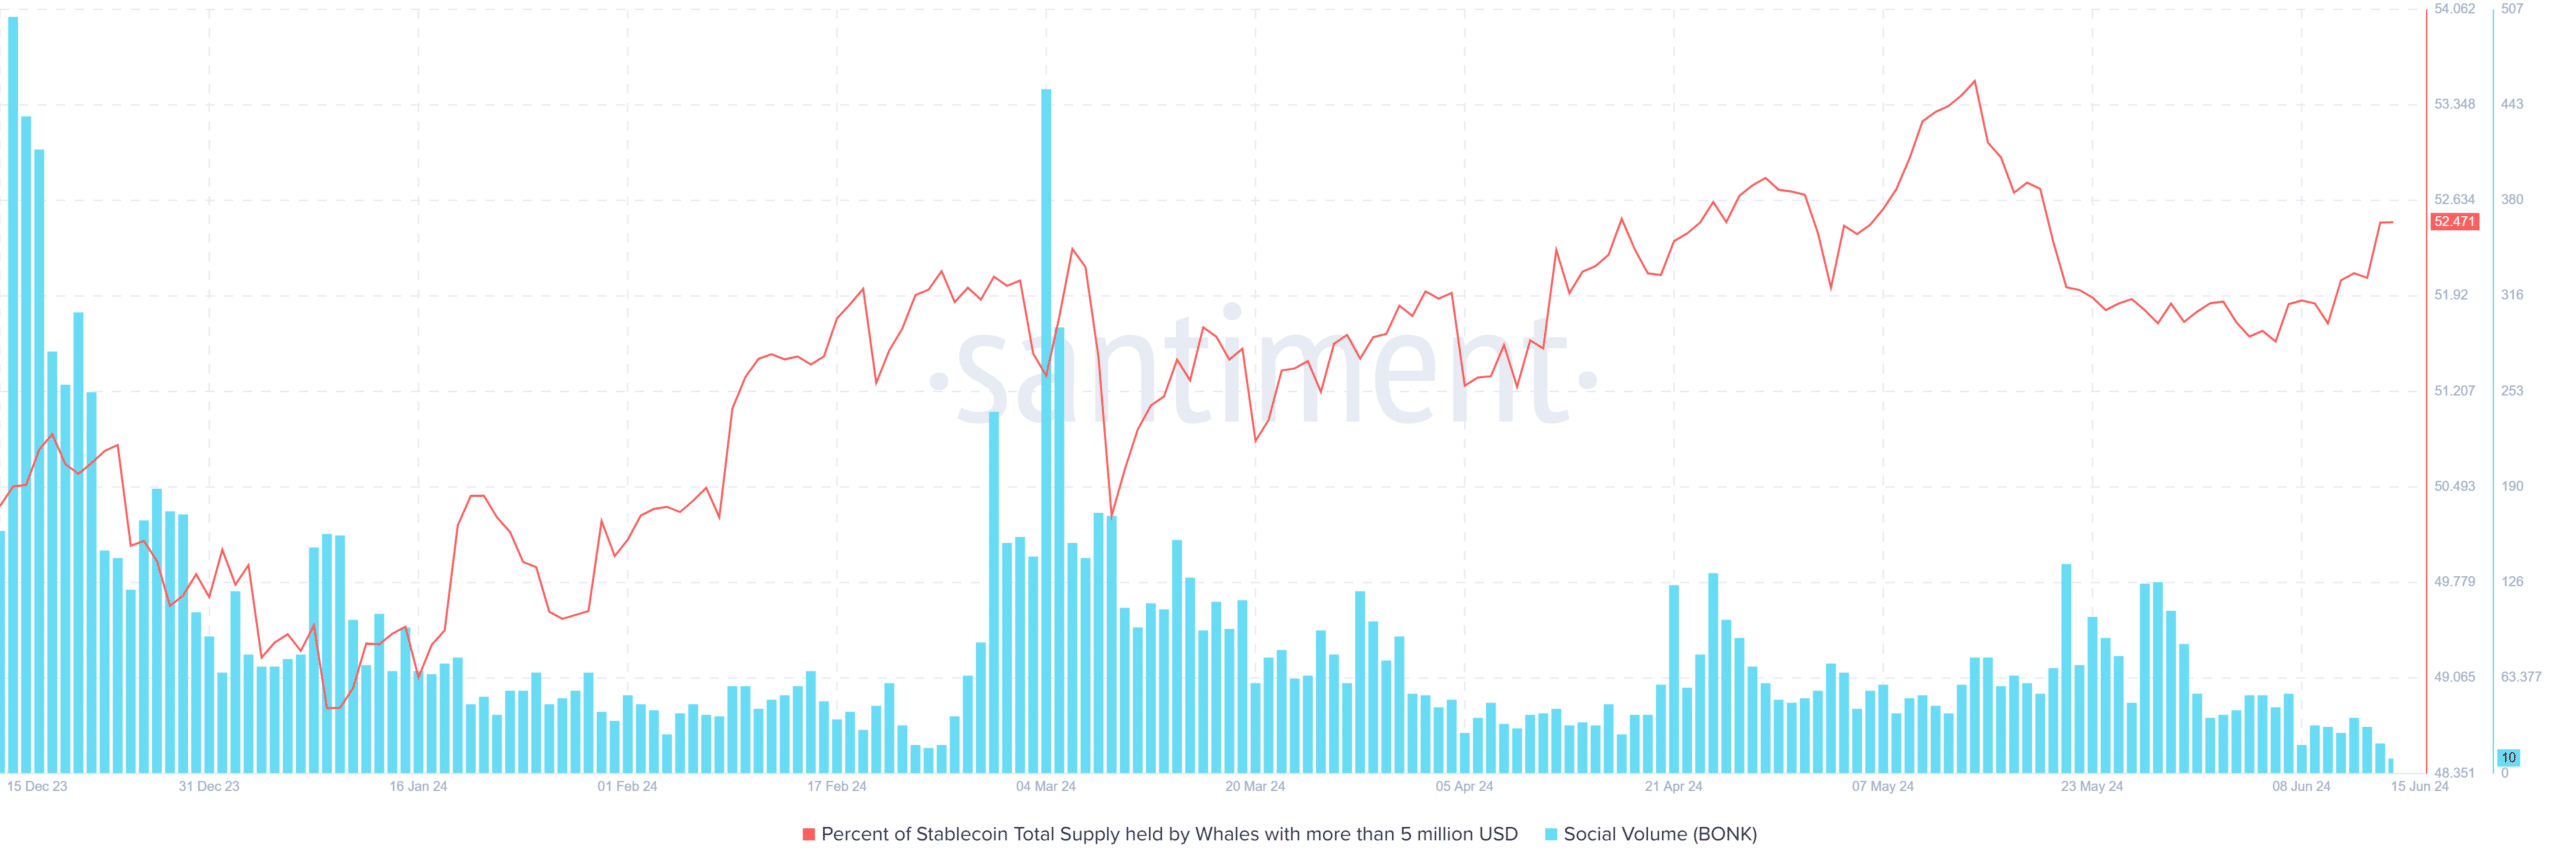
Source: Santiment
What does liquidity add to the support level?
After a look at the price action and Santiment’s inferences pointed to a potential price hike, AMBCrypto assessed the Liquidity map. The liquidity map indicated areas of high leverage and liquidity points.
The map indicated significant activity around $0.0000238 and $0.0000247, which could act as price magnets for the cryptocurrency and its traders.
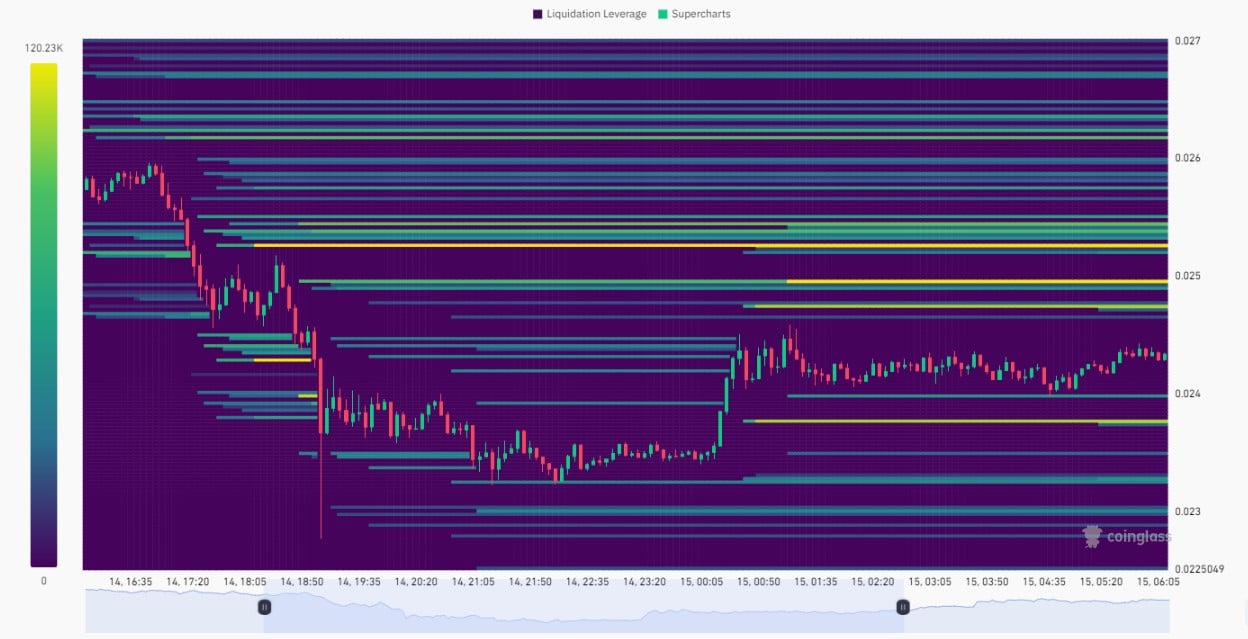
Source: Coinglass
Is it time to buy the dip?
With the price action and on-chain market sentiments suggesting that a bullish reversal may be on the horizon, this could be the best time to buy the dip. However, if the price breaks out of the key support level at $0.00002260, BONK’s price may fall even further.