BTC at $31,000: All about the caveat to this latest bullish step
Bitcoin traders have every reason to celebrate as the king of cryptocurrencies crossed the $31k mark. However, short traders could rain on their parade given the press time position of these indicators.

- As of 3 July, BTC managed to cross the $31k mark amid its latest bullish strides.
- However, BTC’s long/short ratio tipped in favor of short traders.
Cryptocurrency traders and investors entered Q3 2023 with a new-found zeal thanks to the optimistic state of the market. Bitcoin [BTC], in particular, could be considered responsible for this latest market cheer because as of 3 July, BTC managed to stand at $31,196.
With BTC crossing the $31k mark, crypto advisor Will Clemete took to Twitter to share his thoughts about the same. The tweet highlighted BTC’s chart of long-term holder Market Value to Realized Value (MVRV).
Is your portfolio green? Check out the Bitcoin Profit Calculator
Clemete pointed out the similarities between the end of bear markets in 2012, 2016, 2019, and 2023. The tweet also stated that BTC’s bullish stride was only at its beginning.
Onwards and upwards…
In addition to Will Clemente’s tweet, an analyst from CryptoQuant, yblockchain_, also promoted BTC’s bullish stance. As per yblockchain_ and his analysis, BTC’s NUPL value reached the ‘Optimism’ zone as of 3 July. Furthermore, the NUPL value also witnessed an increase recently.
A rise in BTC’s NUPL value indicates that traders are profitable, the market is overripe, and investors have a certain amount of belief in the cryptocurrency. This could be taken as a bullish sign for BTC, especially around its price action in the coming days.

Is a reversal on the charts?
Upon considering BTC’s price action on the daily timeframe, it could be seen that BTC started the day at $30,633. However, surging by 2.45% its press time price stood at $31,381. What looked a little concerning was BTC’s Relative Strength Index (RSI) as it crossed into the oversold region and stood at 70.93 at the time of writing.
The RSI’s move into the oversold region may have BTC witnessing some price correction over the next few hours. Additionally, a look at the Moving Average Convergence Divergence (MACD) indicator also saw the MACD line (blue) in a bullish stance. However, the signal line (red) was seen catching up with the MACD line, thus increasing the possibility of an upcoming price correction.
Although BTC’s Awesome Oscillator (AO) flashed a green bar at press time, the presence of red bars above the zero line confirmed the presence of some bearish sentiment.

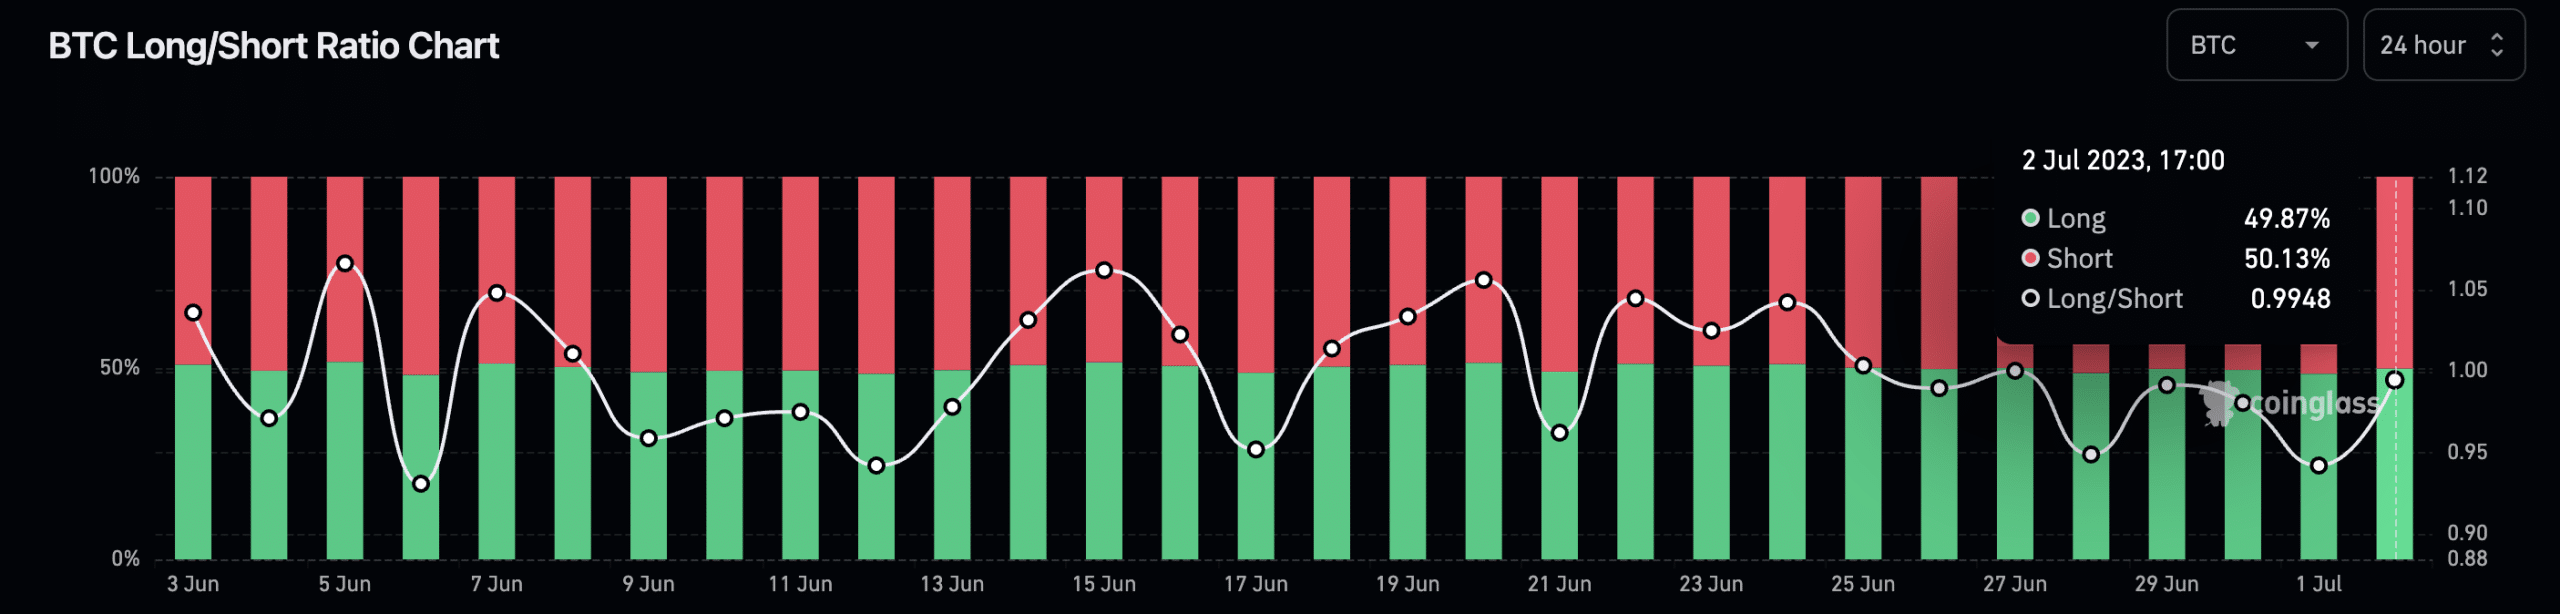
In addition to BTC’s price correction scare, data from coinglass showed that at press time, short holders dominated the market. BTC’s long/short ratio stood at 0.9948 with 50.13% short holders and 49.87% long holders.
Read Bitcoin’s [BTC] Price Prediction 2023-2024
Although the difference between the two cohorts was minimum, the scale tipping in favor of short holders wasn’t a great sign. Furthermore, traders shorting BTC for a profit could drive BTC below the $30k level.
As per data from CoinMarketCap, BTC saw a price surge by 2.19% in the last 24 hours. However, the last one hour saw some negative price action with BTC dropping by 0.36%. BTC’s bull rally could be short-lived if traders continue obsessing over short-term gains over long-term returns.


