BTC cycle to top at $100k? Bitcoin MACD crossover gives clues for investors
Cycles rhyme but do not repeat. In the 2017-18 bull run, the weekly MACD bullish crossover saw a 617% return, but it could be much lesser this time.

- Analyst forecasts a 40% rally for Bitcoin before cycle top.
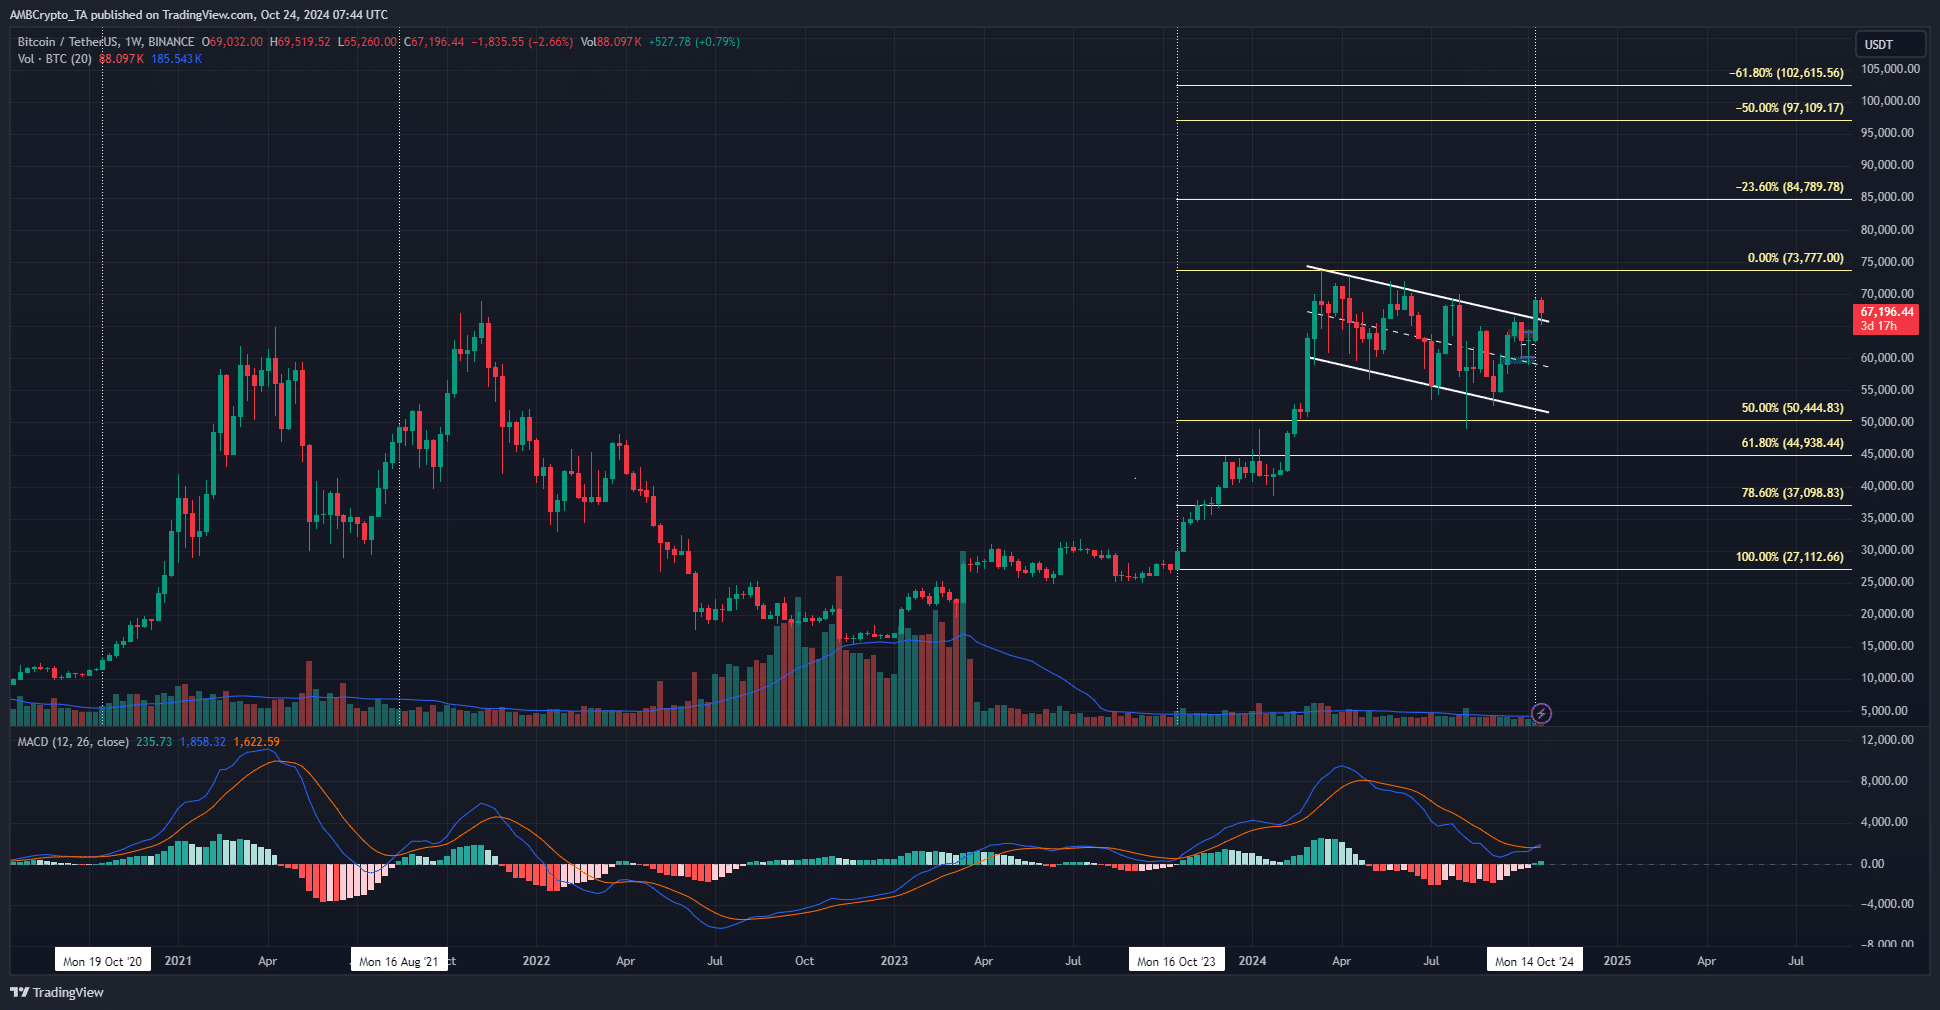
- The Fibonacci extension levels show targets of $109k and $132k.
Bitcoin [BTC] saw a surge in accumulation addresses. The HODL mentality was growing in popularity. Bitcoin addresses that have never had an outflow and a minimum of 10 BTC held 1.5 million coins at the beginning of 2024, but currently held 2.9 million.
The Bitcoin Rainbow Chart gave ultra-optimistic forecasts for the current cycle, targeting $288k or higher. However, historical trends showed that a cycle top could be closer to $100k this time.
Bitcoin set for another 40% rally before the cycle top?
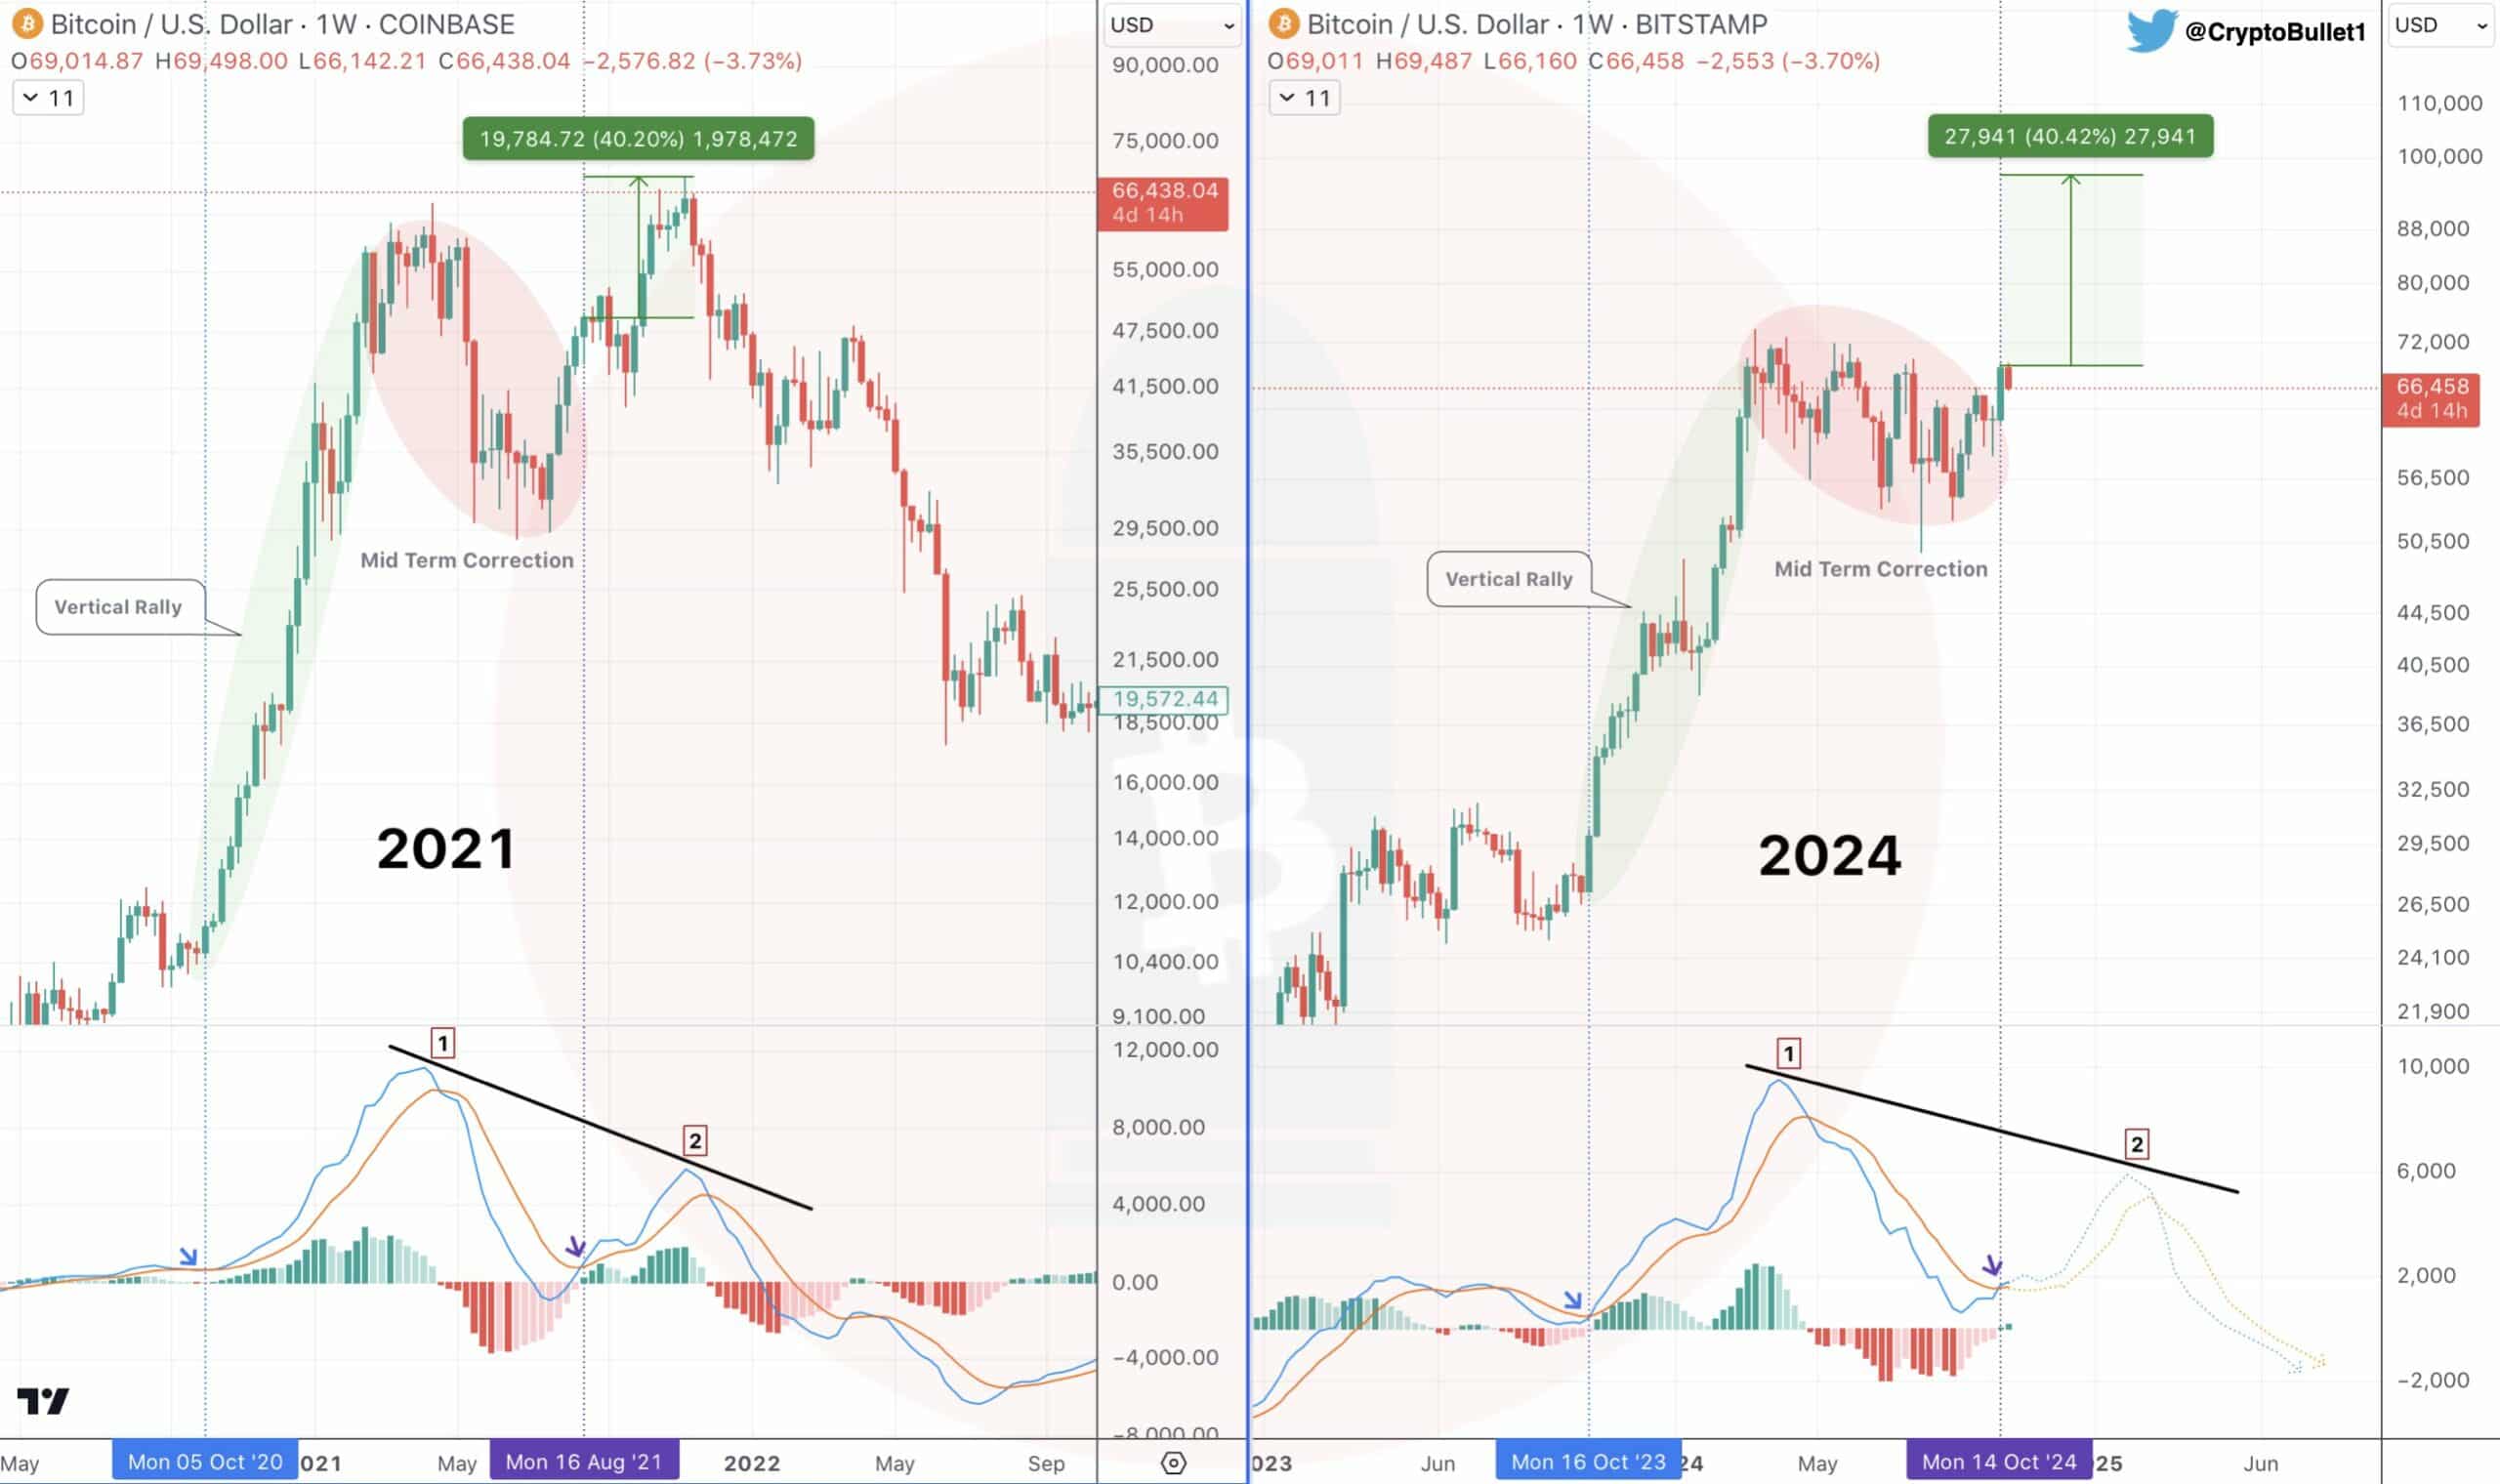
In a post on X, crypto analyst CryptoBullet noted that the weekly MACD formed a bullish crossover for the first time since October 2023. Back then, a rally of 172% occurred within five months.
Yet, this rally was before the Bitcoin halving event. The debate now is- should we expect similar gains, or would the next leg higher end up forming a lower high on the MACD, and end up being the end of the bull run?
The analyst favored the latter scenario. A multi-month consolidation followed by a bullish MACD crossover after a vertical rally would likely not see triple-digit percentage gains. CryptoBullet suggested on his charts that another 40% move higher would be a reasonable target.
Gauging the current targets for Bitcoin
History rhymes but need not repeat. In the 2017-18 bull run, the weekly MACD bullish crossover saw a 617% return, and the 2020 one saw a 468% move. The 2023 one gave 172% in return but happened before the halving date.
Is your portfolio green? Check the Bitcoin Profit Calculator
In 2019 and 2020, Bitcoin rallied 190% from the $3.2k lows set 18 months before the halving. It is possible that the pre-halving run that BTC saw could be broken, and that the 40% price extension target CryptoBullet gave for the next leg could be wrong.
However, as things stand, it seems to be a reasonable expectation. It also ties in well with the Fibonacci extension levels plotted on the weekly chart above.
Disclaimer: The information presented does not constitute financial, investment, trading, or other types of advice and is solely the writer’s opinion