BTC’s cycle bottom: Examining the latest price trends and what lies ahead

- Bitcoin loses downside flexibility after retesting June’s support level.
- Market sentiment switches in favor of the bulls, leading to speculation that the bottom is in.
What if Bitcoin [BTC] is currently in a cycle bottom? This idea has been floating around lately and could be one of the reasons why the bulls are regaining momentum lately.
Is your portfolio green? Check out the Bitcoin Profit Calculator
Bitcoin regained bullish momentum after a downcast start this week. It slid by over 2% on 11 September, Monday, but followed up with a 3.87% rally in the last 24 hours at press time. This bullish performance has got the market pondering on whether it could be a sign that the market has bottomed out.
LunarCrush conducted a survey on X to establish the level of bullish and bearish sentiment. Roughly 56.4% of correspondents anticipated more downside while 43.6% expected the market to be at its bottom.
The crypto market has bottomed.
— LunarCrush Social Trends (@LunarCrush) September 12, 2023
Why the bottom could be in or close
Bitcoin’s crash on 11 September was noteworthy for two main reasons. The price previously struggled to push to lower price levels and once it did, a massive bullish pike followed. This suggested that more traders are confident that lower price levels are more appealing.
Furthermore, the recent dip sent the price for a retest of its June lows (previous support level). Hence, the accumulation at the $24,900 support range. The longs versus shorts ratio also improved in favor of the bulls.
This metric on coinglass revealed that the ratio has been rising from 0.81 on 8 September to 1.02 on 12 September. The same metric showed that shorts dropped slightly during the same period, while longs grew slightly higher.
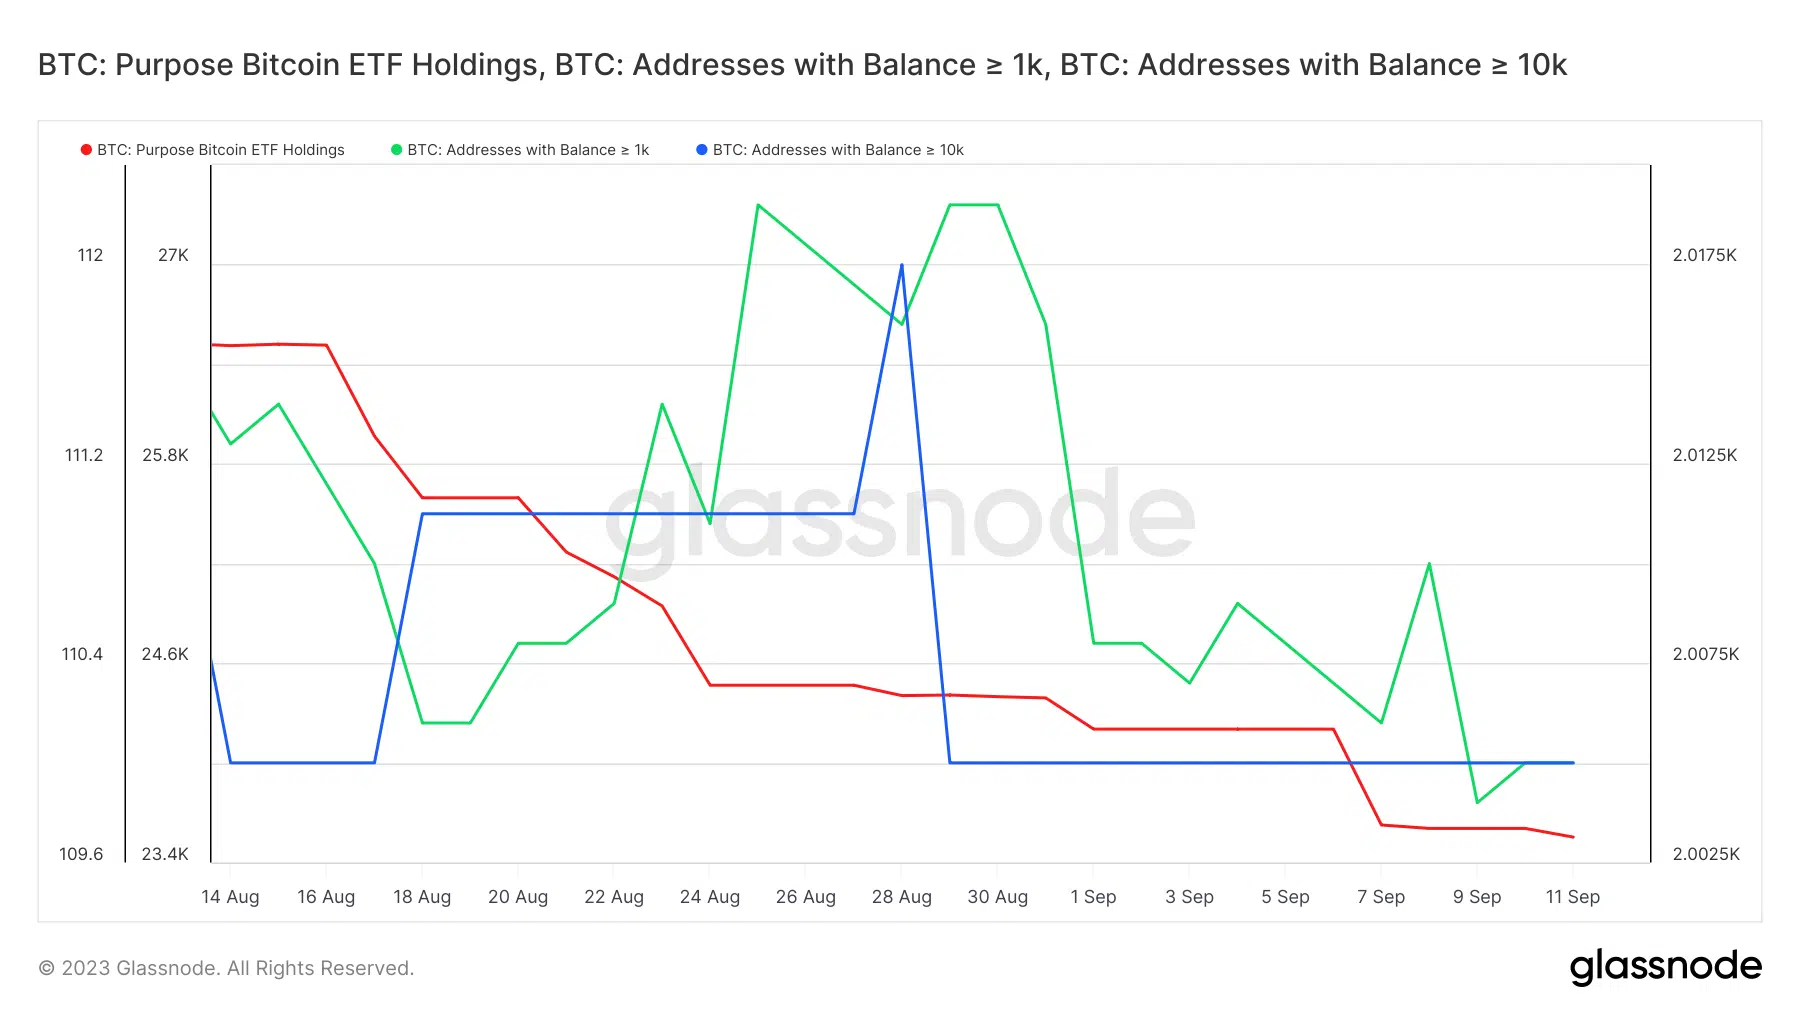
A look at the whale and institutional side revealed that outflows have prevailed for the last four weeks. For example, the Purpose Bitcoin ETF holding metric particularly showed a consistent downside.
Meanwhile, outflows from top addresses (those holding over 1,000 BTC and over 10,000 BTC) recently dropped to monthly lows. However, addresses holding at least 1,000 commenced accumulation on 11 September despite the downside.
We also explored the current state of demand in the derivatives market. Open interest was up slightly at the time of writing, while the estimated leverage ratio dropped slightly.
This could signal that some traders could be exciting their short positions especially now that the sentiment was in favor of the bulls. On the other hand, the market is still cautious hence the low rate of leveraged longs.
How many are 1,10,100 BTCs worth today
In summary, the above findings indicate that the market currently leans in favor of bullish expectations. The recent lows have so far demonstrated strong consolidation and low sell pressure below the $25,000 price range. However, these findings do not rule out the possibility of more downside below the current support.


