Buckle up ETH traders! You could be in for a little surprise this weekend…
Ethereum flashed strong bullish signs that may last the weekend as the king of altcoins made it to the list of top ten trending searches as per LunarCrush. ETH's price action could offer a some respite to traders and investors.

- The amount of supply last active (5y-7y) reached an all-time high as of 5 May.
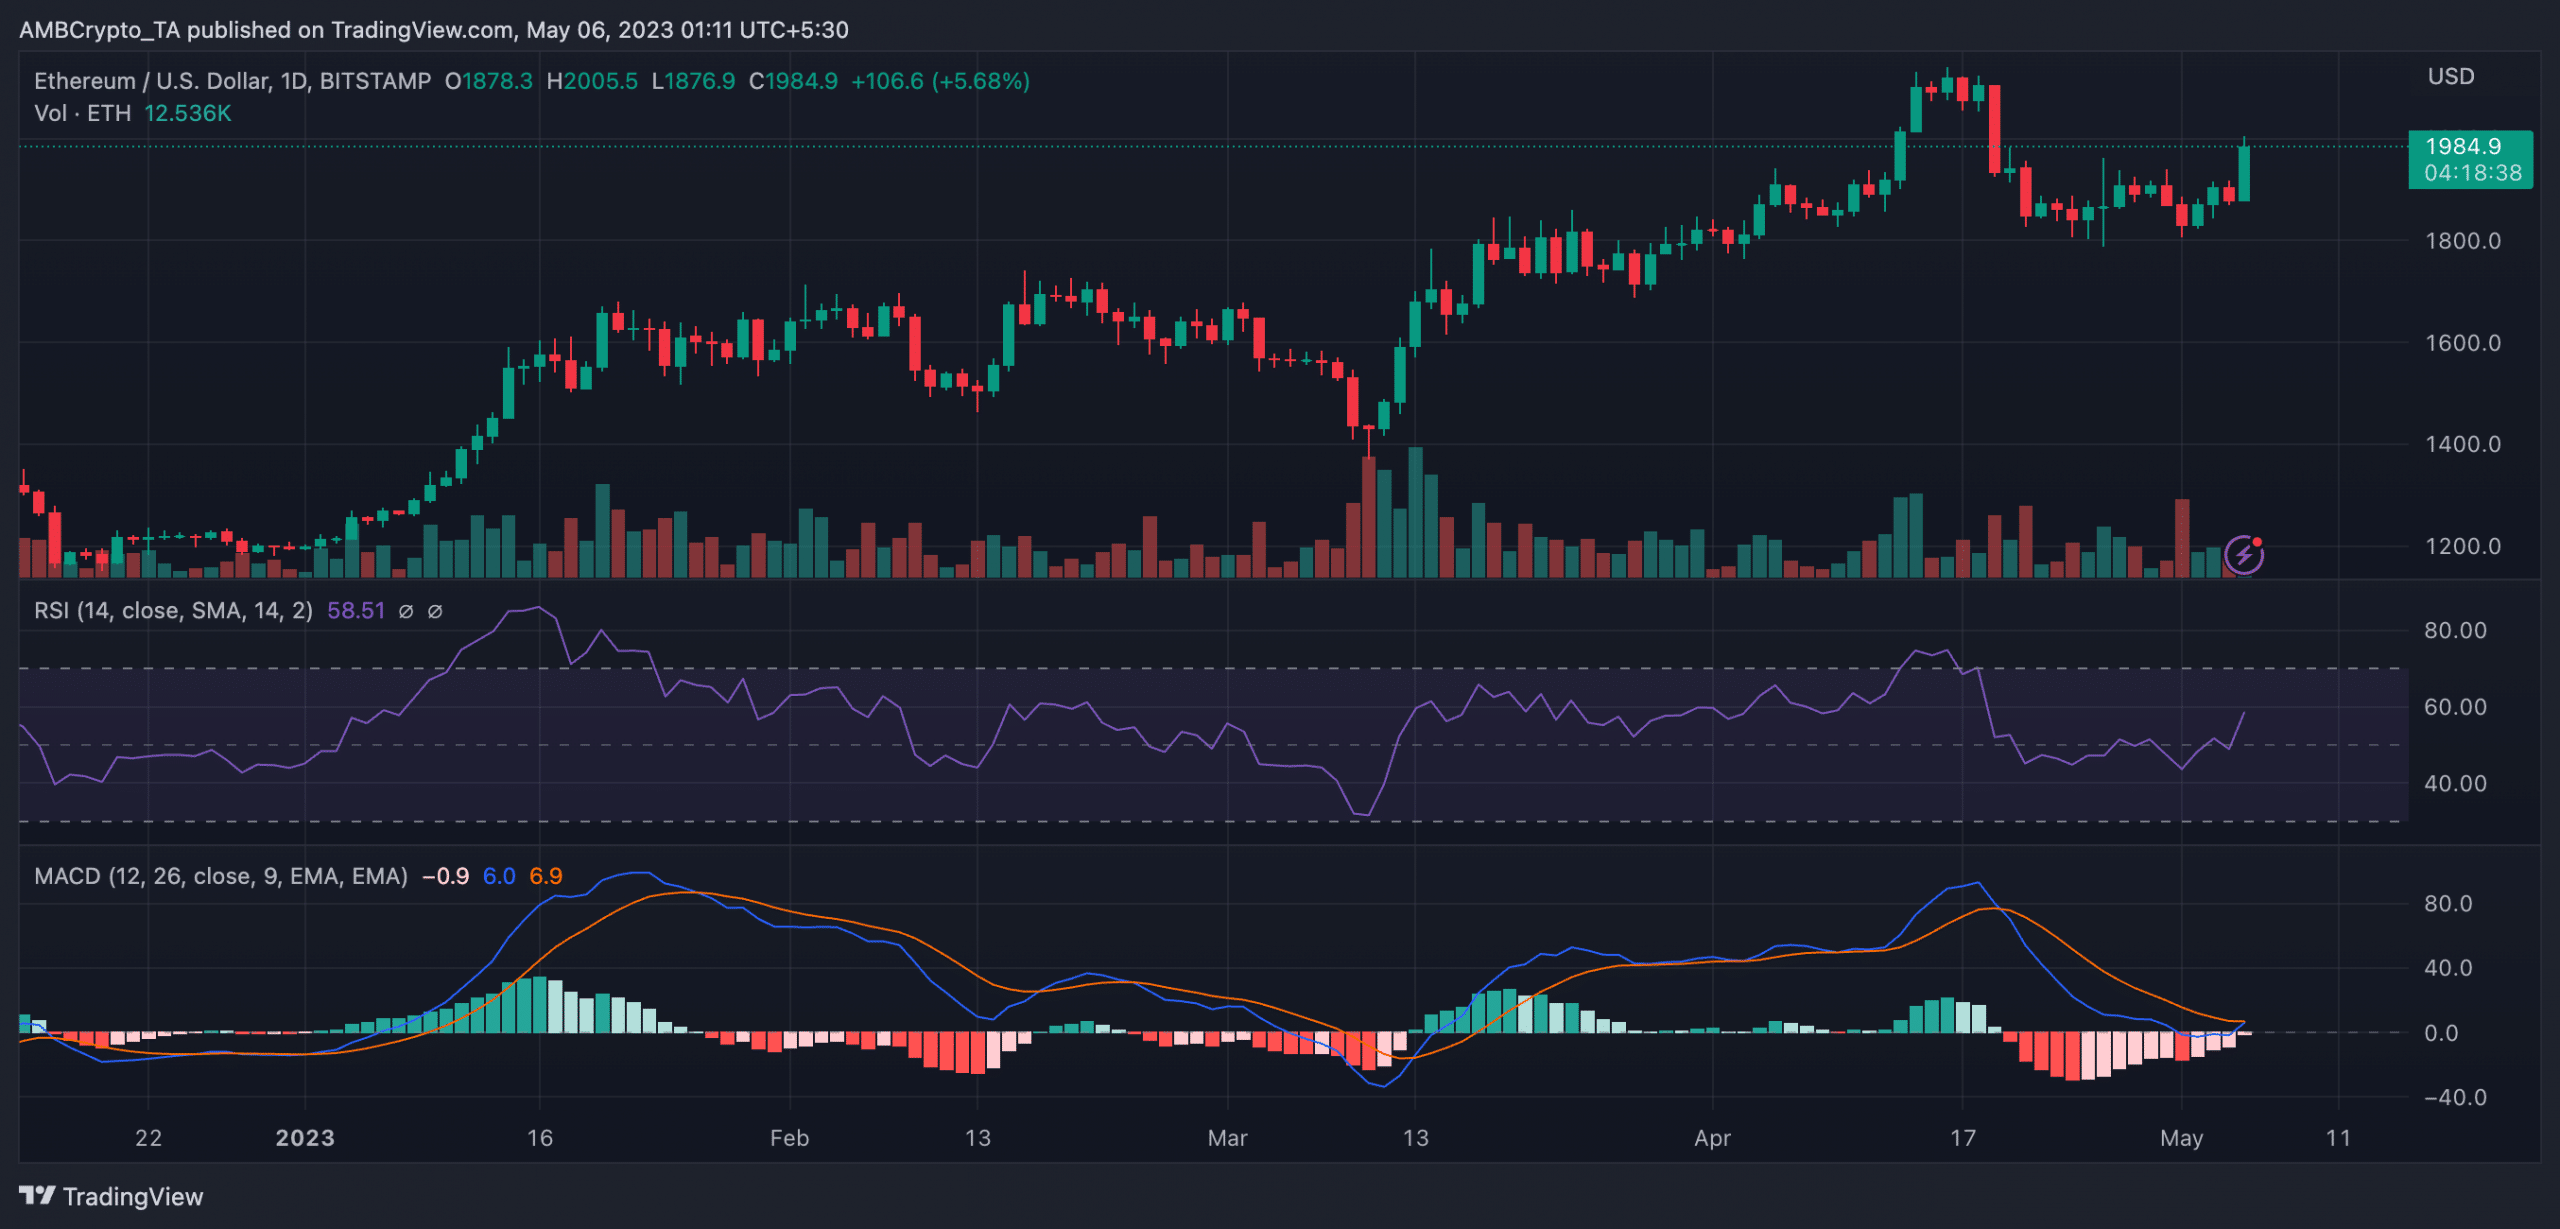
- ETH’s RSI and MACD also flashed bullish signs that may extend into the coming week.
The last seven days have been quite the roller coaster for Ethereum [ETH] with its price going up and down after regular intervals. As per data from CoinMarketCap, the king of altcoins traded 4.63% higher than the last seven days and was up by 5.86% in the last 24 hours.
At press time, ETH was exchanging hands at $1,984. However, that wasn’t all ETH had to offer. As per data from LunarCrush, ETH made it to the top ten trending searches on LunarCrush. Although at #6, ETH was drawing the attention of the market.
Here are the top ten current trending searches🔍 on LunarCrush.
1️⃣ $btc
2️⃣ $vra
3️⃣ $lunr
4️⃣ $brise
5️⃣ $doge
6️⃣ $eth
7️⃣ $dino
8️⃣ $sol
9️⃣ $burger
🔟 $maticInsights: https://t.co/IAN6SHYwfo pic.twitter.com/VjtzGnlQ5U
— LunarCrush (@LunarCrush) May 5, 2023
Read Ethereum’s [ETH] Price Prediction 2023-2024
A bullish wave in the making?
In addition to the aforementioned information, data from Glassnode stated that ETH’s supply last active (5y-7y) reached an all-time high. The nine-month high indicated that investors were holding on to their ETH holdings for the long term.
📈 #Ethereum $ETH Amount of Supply Last Active 5y-7y just reached a 9-month high of 10,618,217.743 ETH
View metric:https://t.co/IEN283QP0E pic.twitter.com/hWeKDrPPNY
— glassnode alerts (@glassnodealerts) May 5, 2023
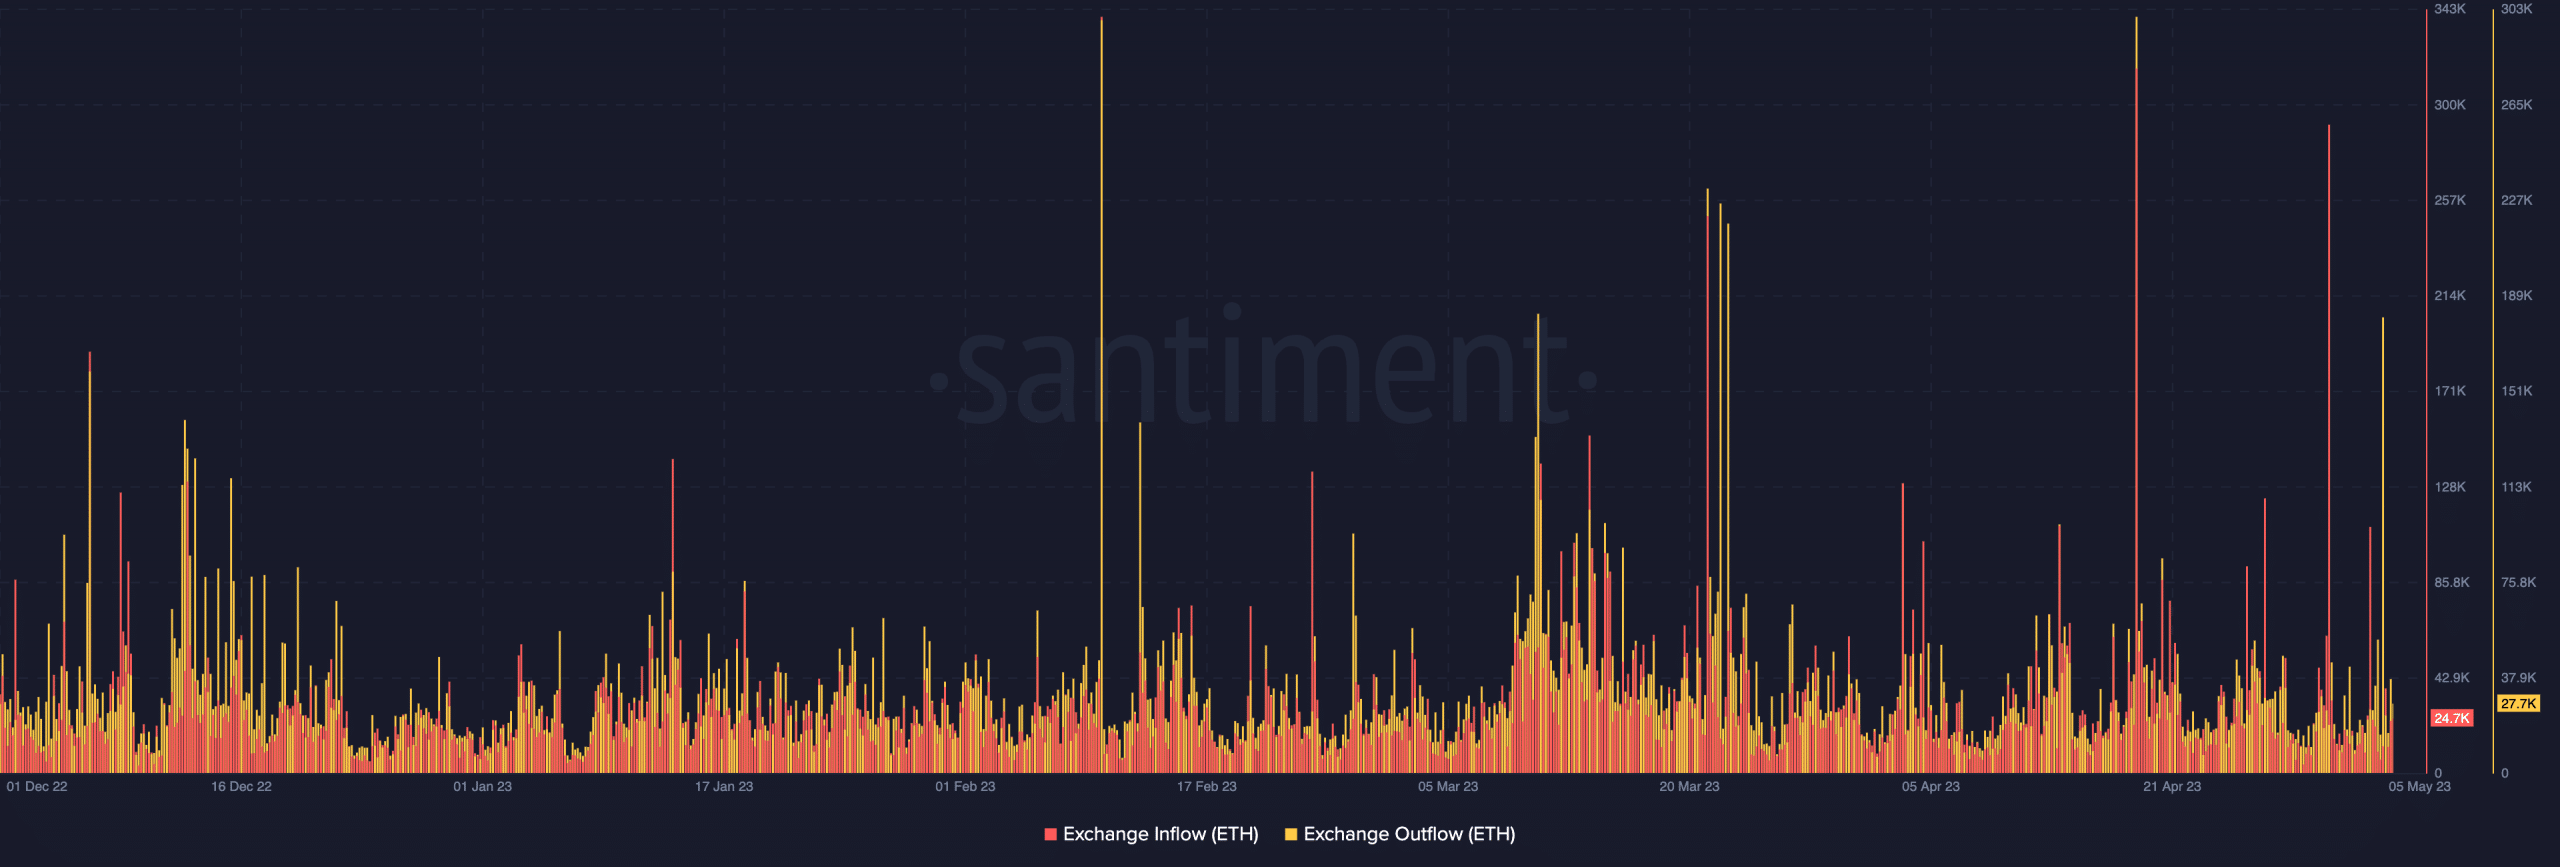
Furthermore, at the time of writing, data from Santiment showed that ETH’s exchange outflows outnumbered the exchange inflows. This was a bullish sign as more and more investors were moving their ETH out of exchanges than into the exchanges. At press time, ETH’s exchange outflows stood at 27.7k whereas exchange inflows stood at 24.7k.
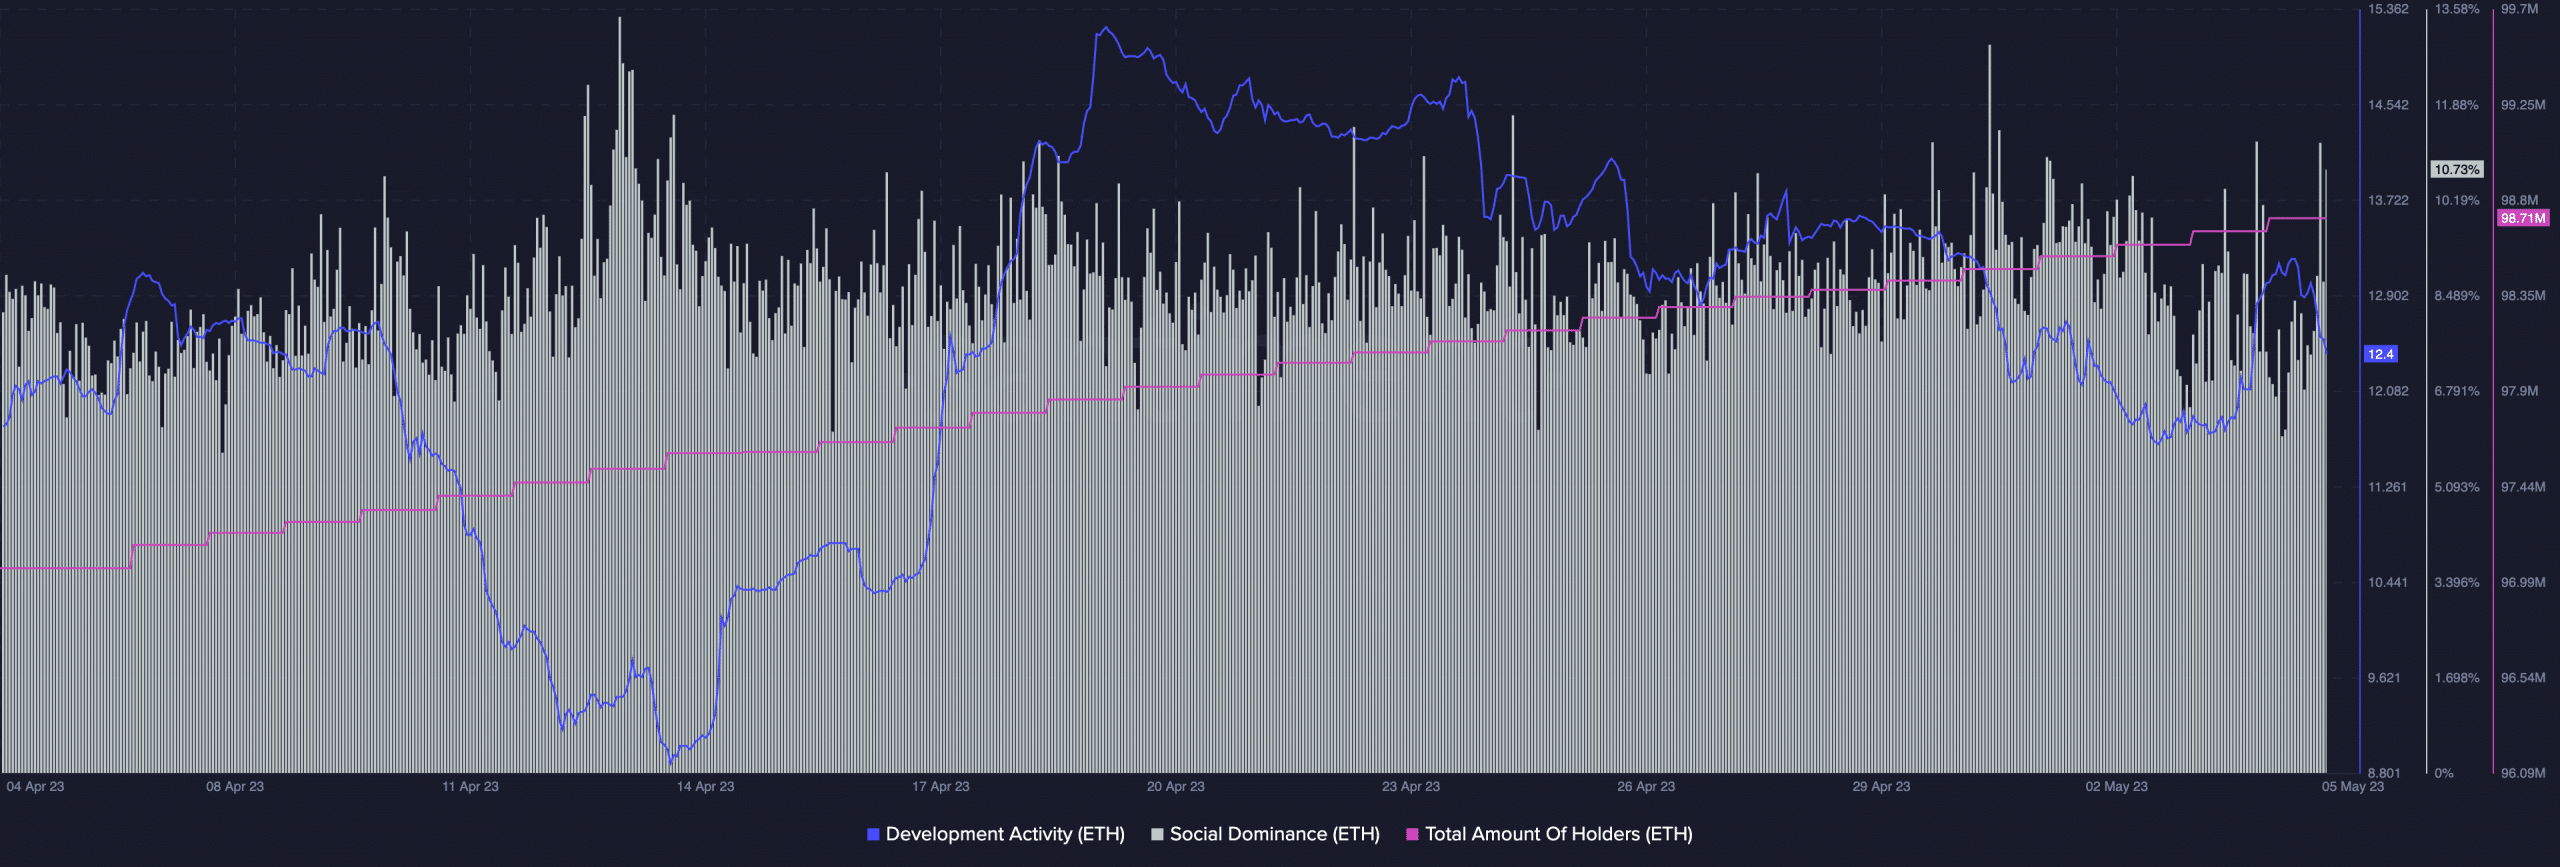
However, a look at ETH’s on-chain metrics in the last month didn’t exactly paint a pretty picture. Although ETH’s social dominance mostly saw peaks throughout the month, the amount of ETH holders didn’t show any drastic changes.
The number of ETH holders did rise consistently throughout the month, but at press time, it remained at the same level as the last three days. Additionally, ETH’s development activity at press time stood at 12.4. Furthermore, it witnessed a drop, which meant that developers weren’t making enough contributions to the chain.
The price could unleash some…
…bulls? Traders looking for some signs of positivity in ETH’s price action may have their wish fulfilled. This was because, at the time of writing, ETH was exchanging hands in the green. ETH’s Relative Strength Index (RSI) also stood at 58.51.
What was noteworthy about the RSI was that, at press time, it was in a sharp uptrend. In the presence of the ongoing bullish momentum, ETH’s price could manage to surge higher over the weekend.
Realistic or not, here’s ETH’s market cap in BTC terms
Furthermore, ETH’s Moving Average Convergence Divergence (MACD) indicator showed that the MACD line touched the signal line with a strong possibility of the MACD line crossing over the signal line. The MACD line crossing over the signal line above the zero line was a strong bullish indicator for ETH.