


![BUILDon [B]: Can perpetual traders beat the death cross?](https://ambcrypto.com/wp-content/uploads/2026/07/Abdul-41-1024x576.webp)
BUILDon [B] has been one of the standout assets in the market over the past day, with sentiment pushing the token 12% within the period.
Community sentiment on CoinMarketCap reflects this outlook, as roughly 100% of votes cast on the platform lean bullish on BUILDon. However, several other factors could determine whether the rally is sustainable or a breakdown lies ahead.
What’s driving the BUILDon rally
Traders in the perpetual market have had the clearest impact on B’s price surge.
The key metric has been the positive Funding Rate, which, at a reading of 0.0101% as of writing, implied that the net-long positions dominate the market.
However, the Funding Rate, despite being positive, has remained mild, suggesting long positioning in the market has yet to grow overheated.
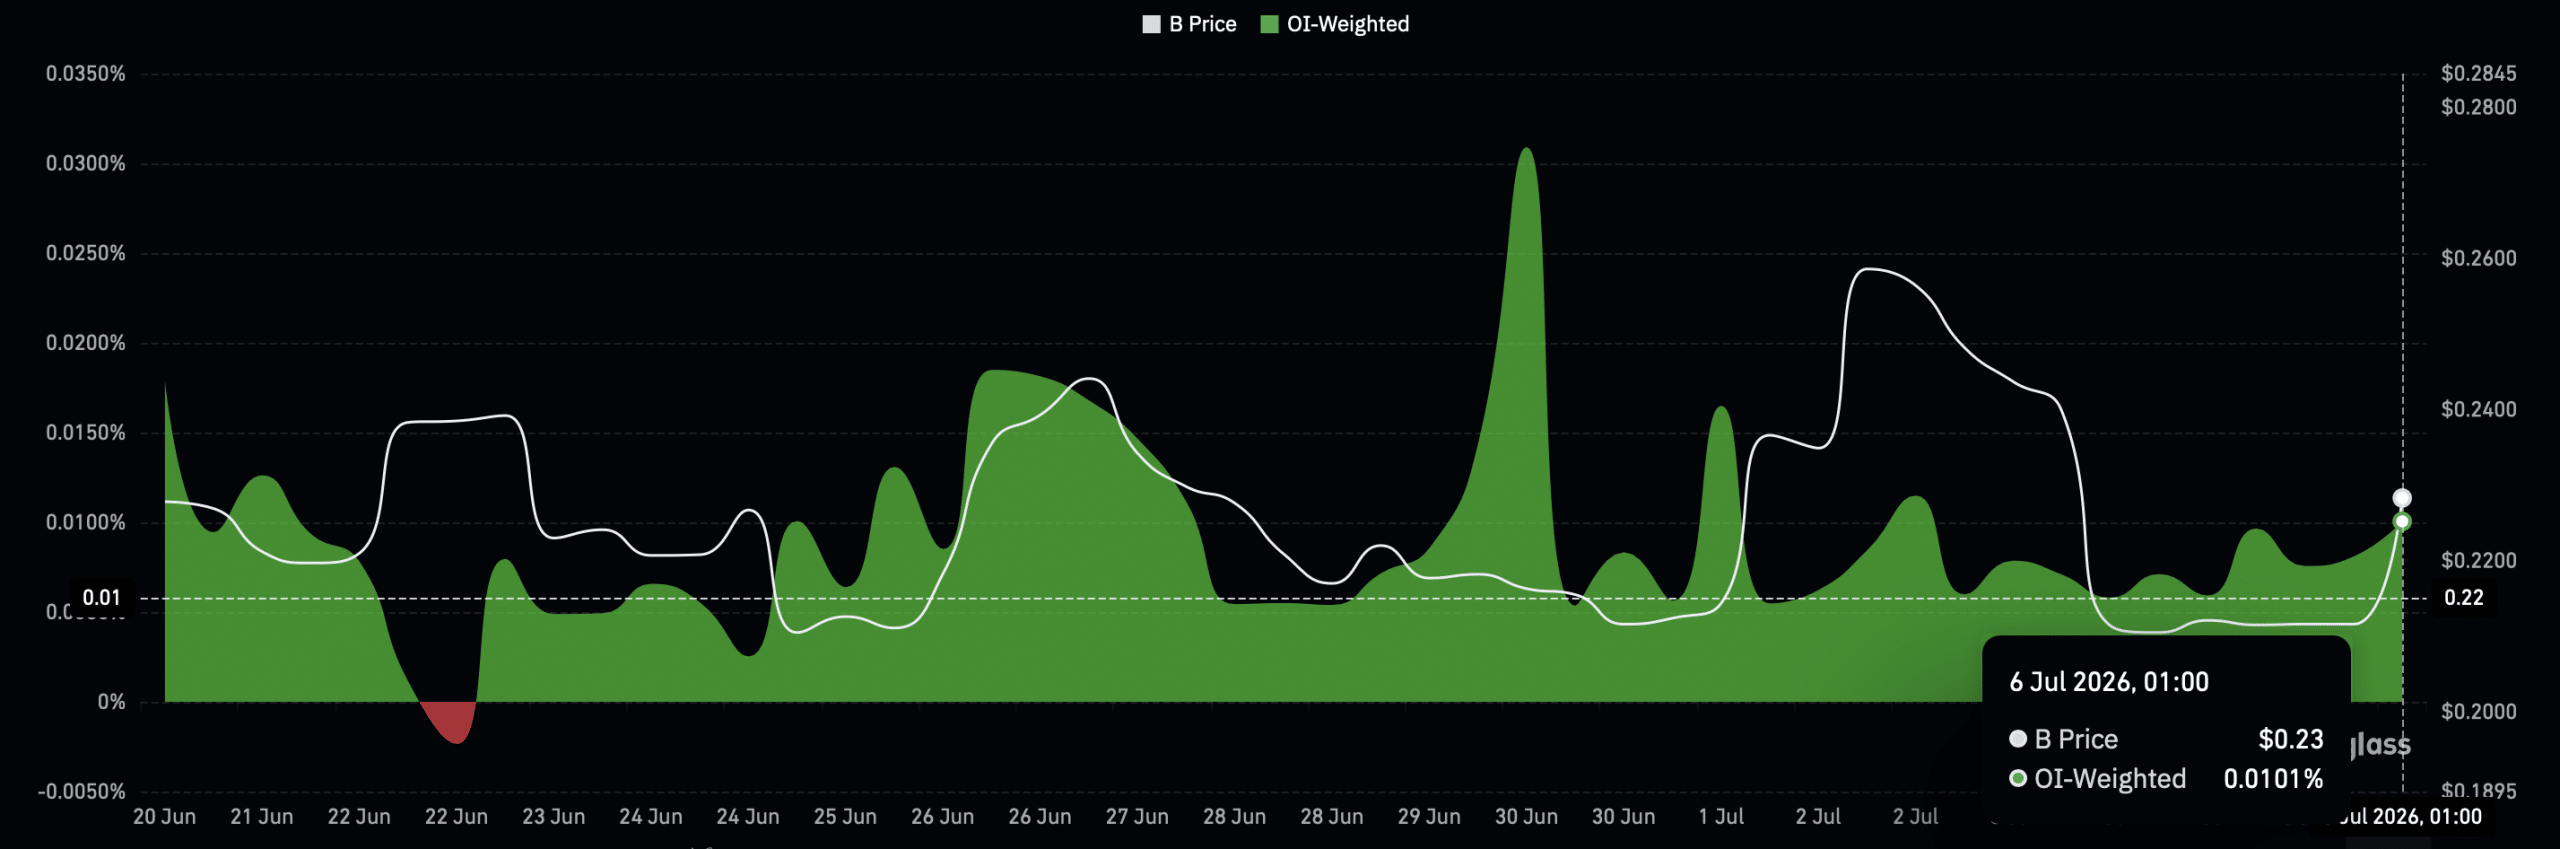
Growing capital in the perpetual market has added to this outlook as well. Open Interest, which measures this capital, has risen 5.44% to $27.34 million.
Continued bullish bets from these traders, without the market overheating, would support B’s broader performance and help sustain the rally as it extends higher.
Decoding BUILDon’s structural gap
Analysis of the perpetual market alone isn’t sufficient to determine the direction the asset would take. BUILDon’s chart shows the asset being hindered by resistance at the 200-day SMA.
Beyond the 20 SMA recently crossing below it, a death cross that reads as bearish, this level has forced price lower on four separate occasions and could deliver the same impact again.
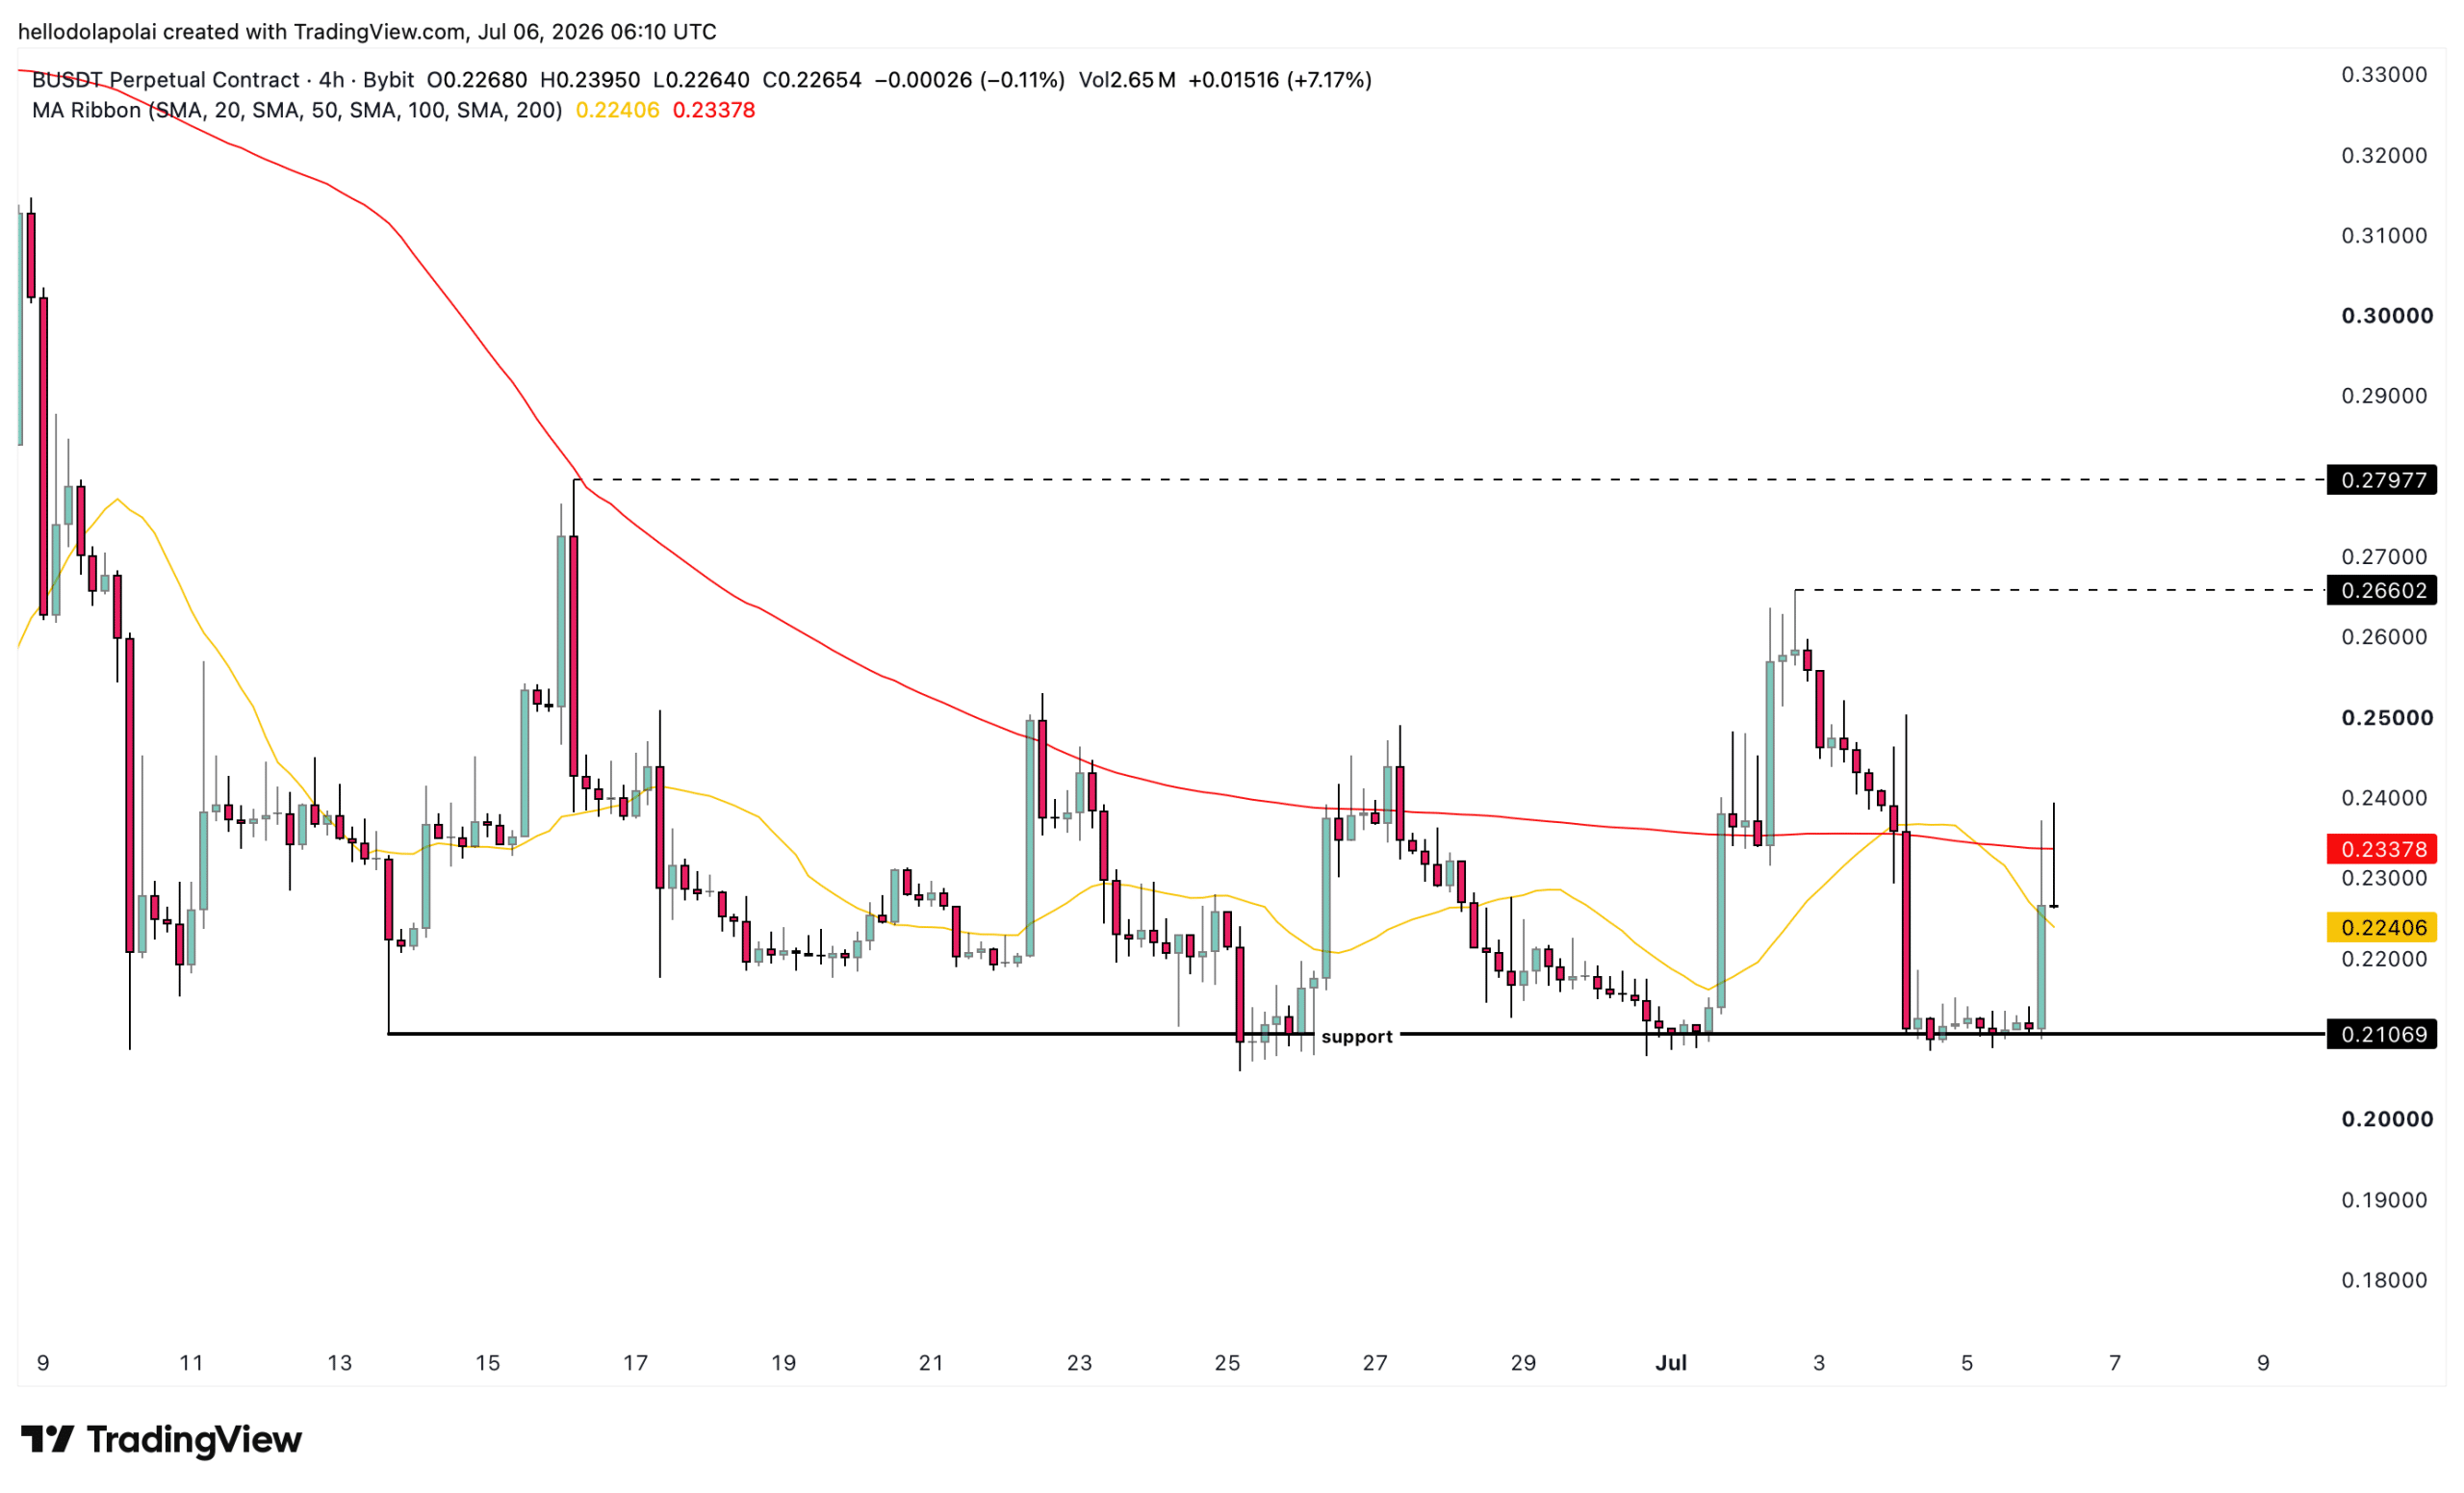
If selling pressure emerges as it has in the past, BUILDon could drop to the lower support at $0.21, marked in black on the chart. There, it would likely consolidate briefly before attempting an upswing, provided the pressure isn’t extensive.
On the other hand, if the 200 SMA resistance fails, two key levels stand out: $0.266, the nearest price level, and $0.279, the next target. Both could offer a solid upward run.
Selling pressure builds beneath B’s rally
While the price chart leaves room for a move in either direction and a possible struggle ahead, it doesn’t confirm the sentiment.
The Chaikin Money Flow, which tracks whether buy-side or sell-side volume dominates, shows that selling pressure has been growing significantly, as the CMF isn’t just in negative territory but is presently declining even lower on the chart.
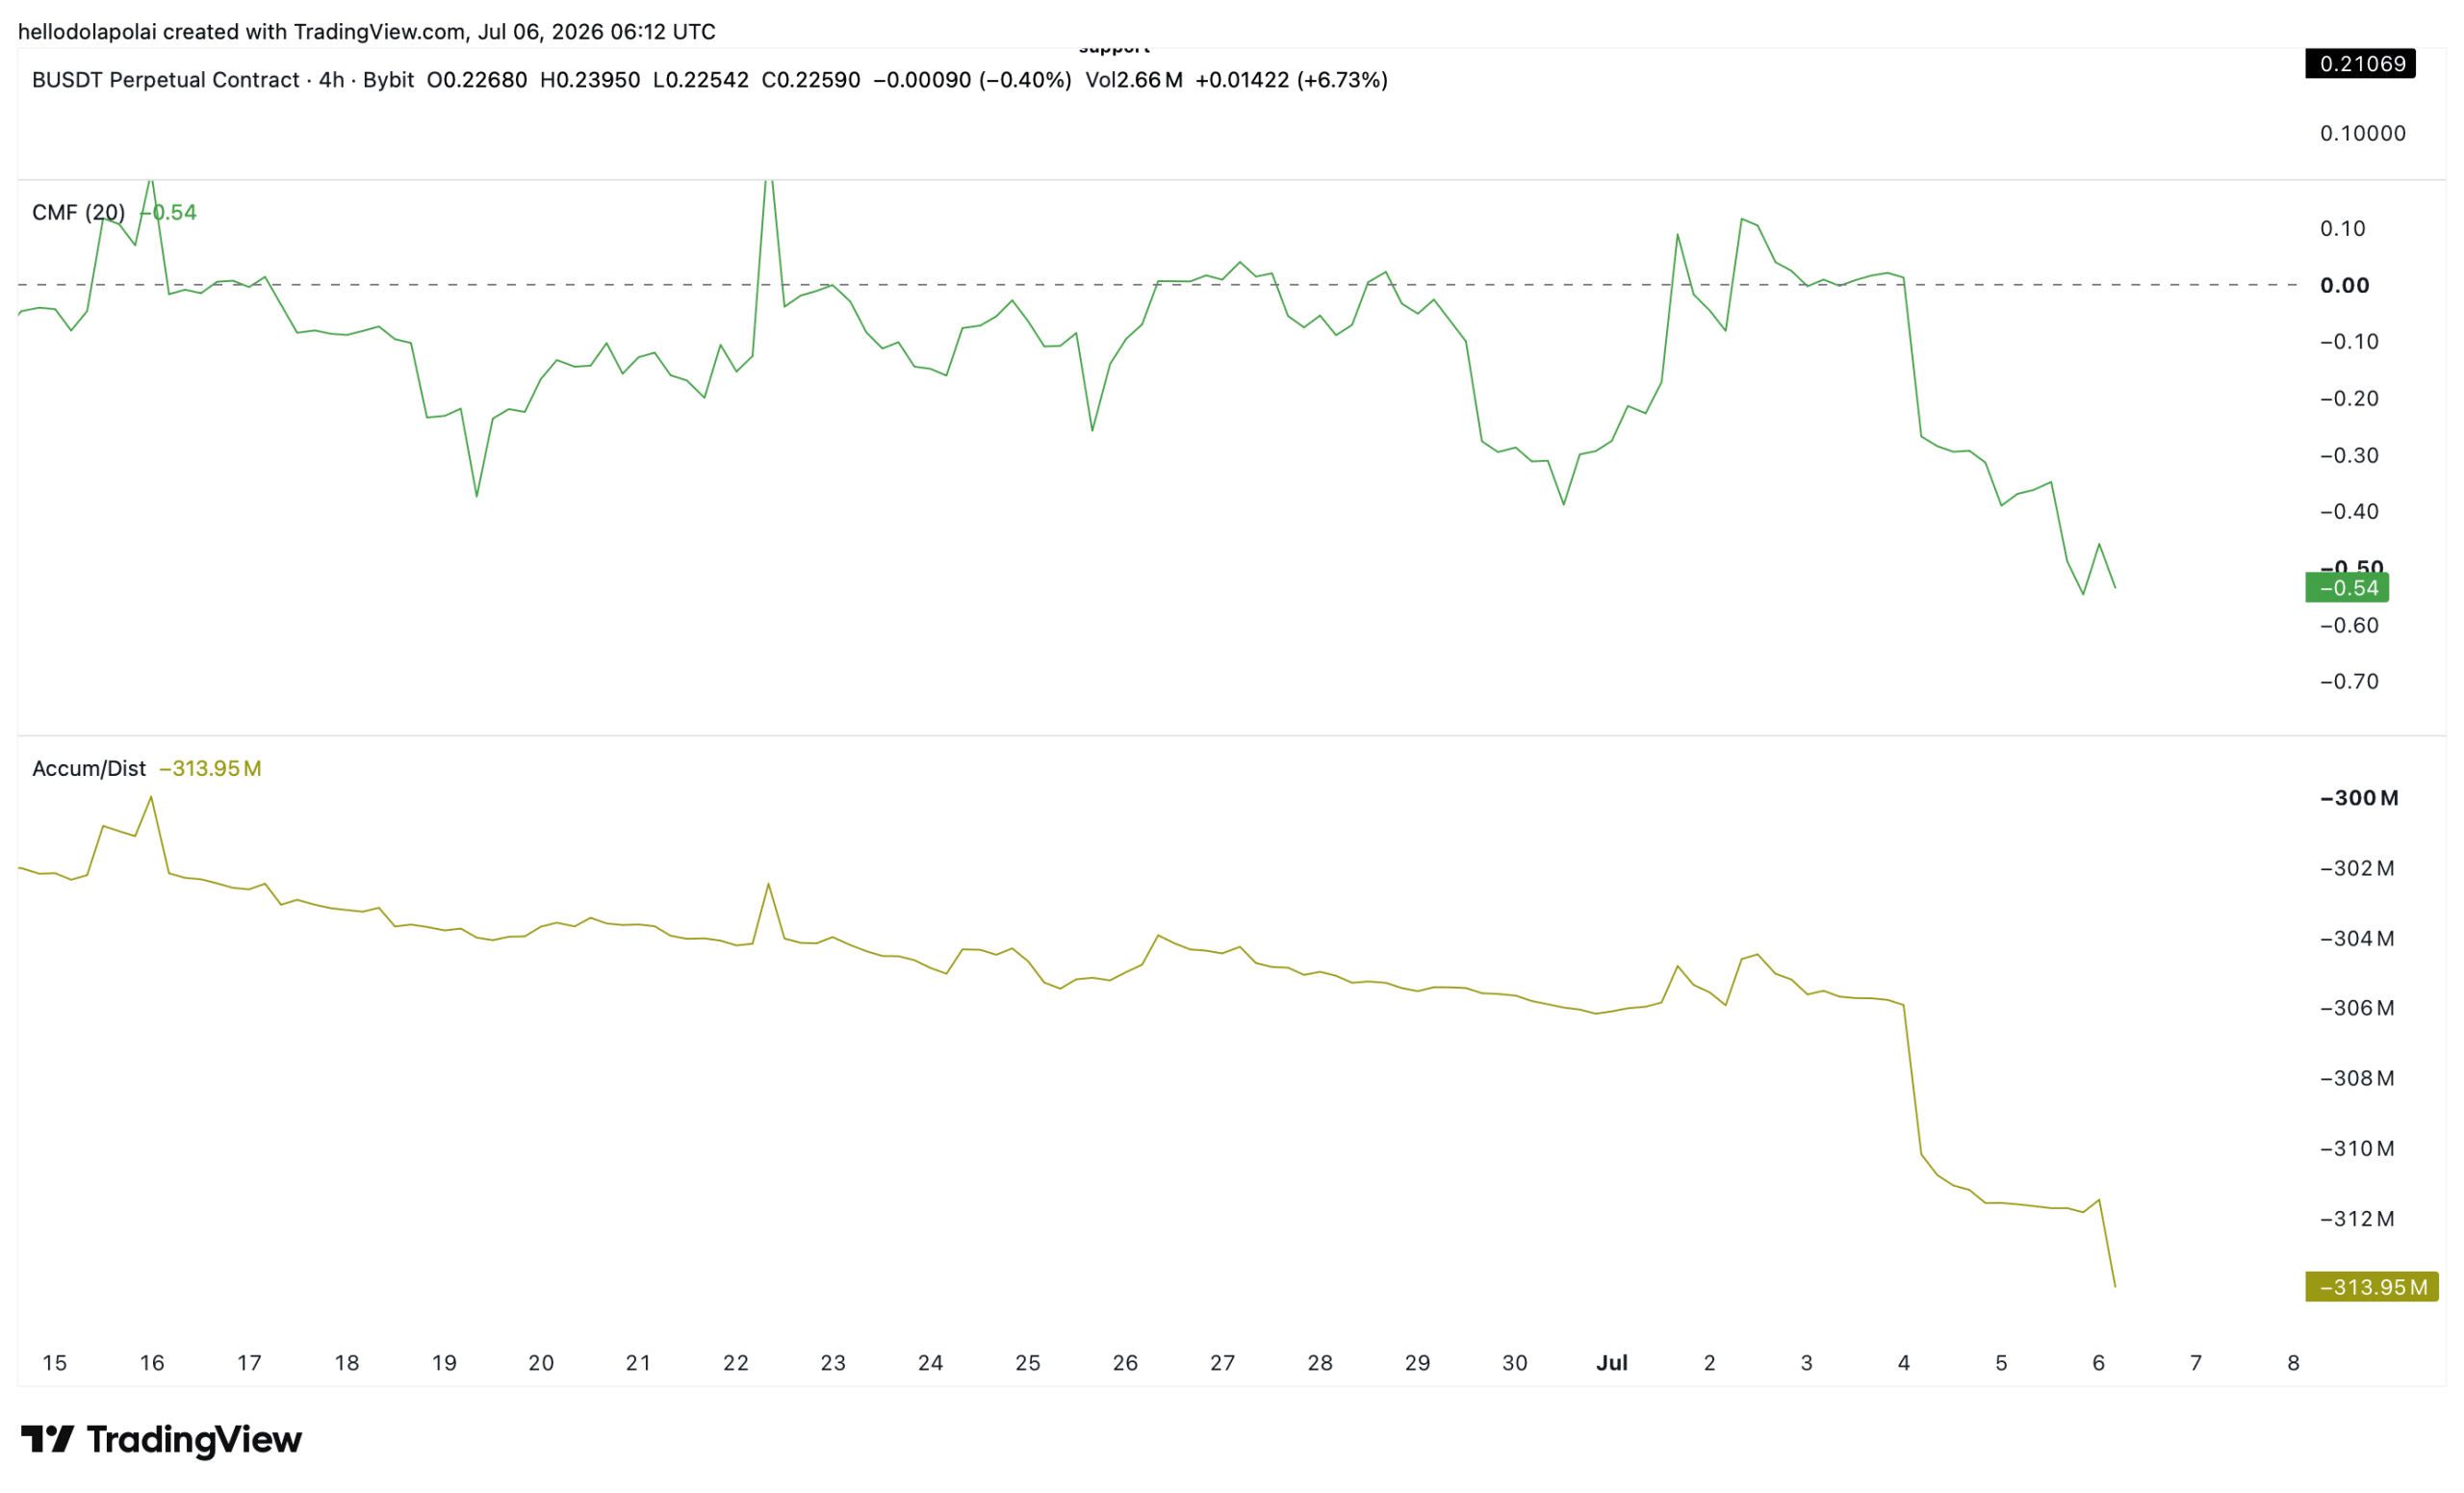
The Accumulation/Distribution indicator, which confirms whether investors have been buying or selling in the market, has also turned down into the negative region.
Layering this on actual volume data shows that volume remains elevated at $7.25 million, a 25% increase over the past day. Unless volume drops significantly, there’s a high chance B continues to move upward until the momentum weakens.
Final Summary
- BUILDon’s 12% rally was perp-driven, as the Open Interest rose to $27.34 million, showing net-long conviction that hasn’t overheated.
- However, the chart disagreed, with a fresh death cross, 200-day SMA resistance, and negative CMF and A/D readings all pointing lower unless volume holds.