BUILDon climbs 17% – Why THIS liquidity zone could decide B’s next move
BUILDon's rally and rising Open Interest shifted focus toward the $0.212 liquidation zone and higher resistance.



BUILDon [B] rallied 17.72% over the past 24 hours at press time, bringing bullish conviction back into focus after several sessions of consolidation. The token climbed to $0.1910, while its market capitalization expanded to $191.01 million, reflecting stronger capital inflows across the market.
Trading activity also accelerated as 24-hour volume jumped 57.01% to $11.47 million, reinforcing the renewed appetite for the asset. This combination suggested that buyers returned with greater confidence rather than reacting to a temporary price spike.
In addition, the rising participation strengthened the recovery narrative after BUILDon rebounded from recent lows. However, the latest advance still left the token below higher resistance levels, indicating that buyers had not yet completed a broader trend reversal despite the improving market structure.
Analyzing BUILDon’s speculative demand
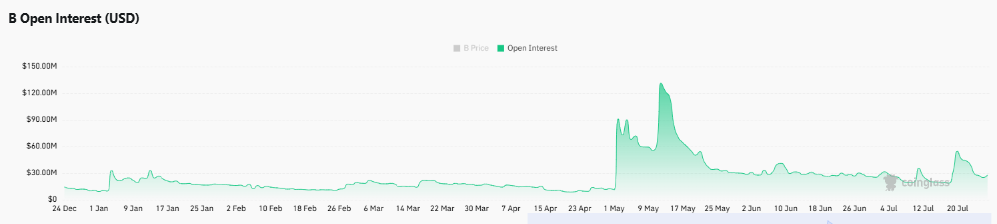
Derivatives traders also increased their exposure as Open Interest (OI) climbed 21% to $29.49 million, signaling fresh capital entered leveraged positions.
This increase aligned with the token’s price appreciation instead of developing against it, suggesting that traders actively supported the ongoing rally. Such behavior often reflected stronger conviction because both price and futures participation expanded together.
Meanwhile, the higher OI indicated that market participants expected additional price movement rather than closing existing contracts after the recent gains. Even so, the larger number of leveraged positions also increased the likelihood of sharper volatility should sentiment shift unexpectedly.
Nevertheless, the synchronized rise in price and Open Interest strengthened the argument that fresh speculative demand fueled the latest advance instead of short-term position adjustments.
Can BUILDon reclaim the next resistance?
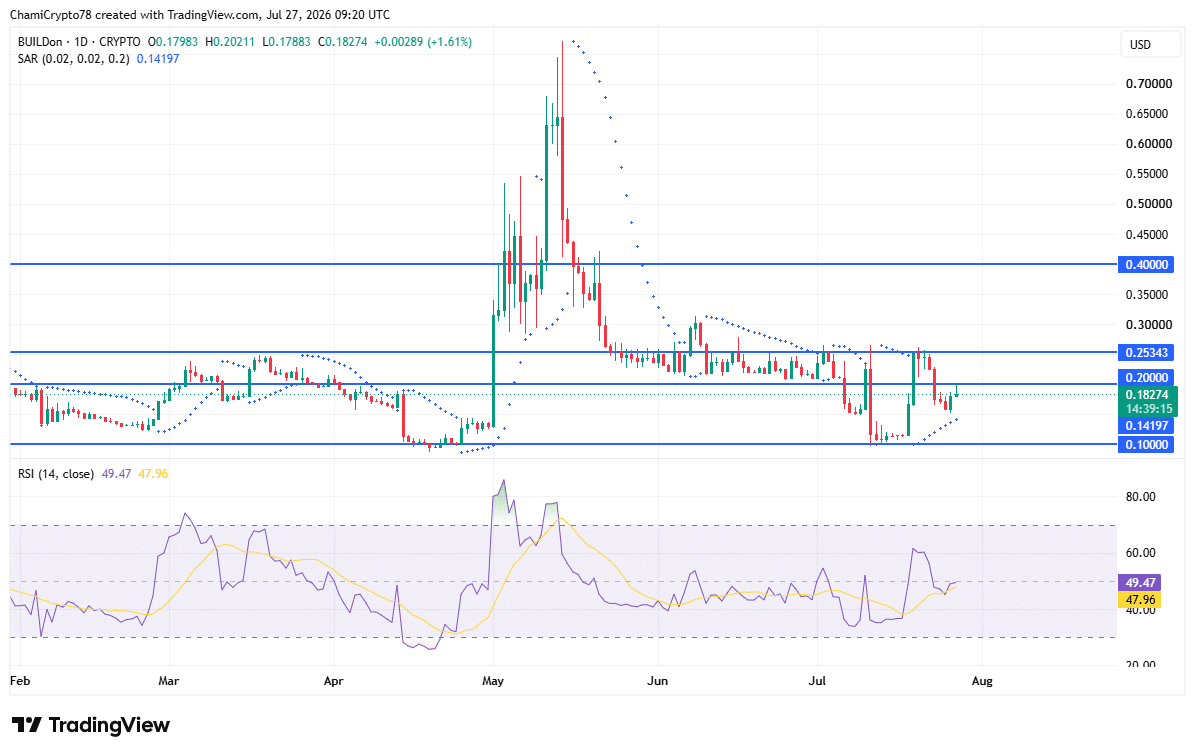
BUILDon recovered steadily after defending the $0.1419 support zone and moved back toward the $0.2000 resistance level. The chart also showed another resistance around $0.2534, which remained the next major hurdle should buyers reclaim the nearer barrier.
Meanwhile, the Relative Strength Index rose to 49.47 as of writing, recovering from weaker readings and returning close to the neutral threshold. This improvement suggested buying strength had stabilized instead of fading.
In addition, the Parabolic SAR flipped below the current price. This confirmed that the recent trend shifted back in favor of buyers after the previous decline. If buying pressure continues building, BUILDon could challenge $0.2000 before attempting $0.2534.
However, renewed selling interest around resistance could keep the price fluctuating inside the current trading range before another breakout attempt emerges.
Why does the $0.212 zone matter most now?
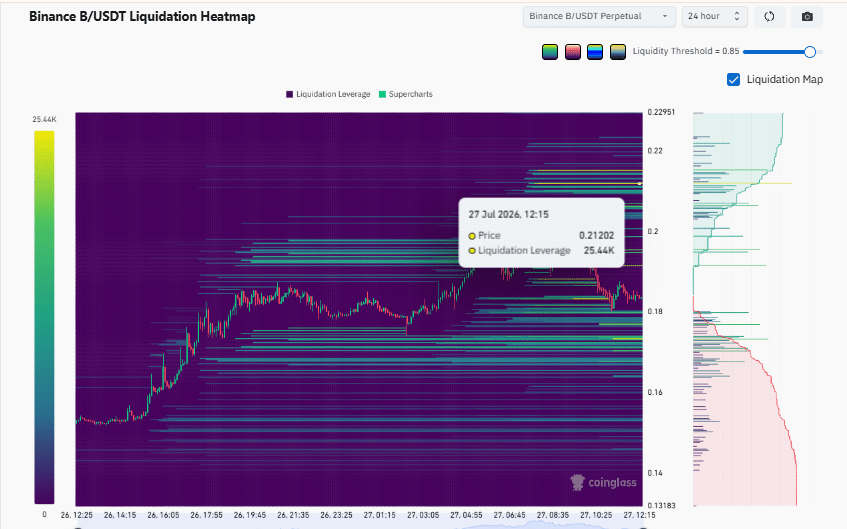
The Liquidation Heatmap identified $0.2120 as BUILDon’s most significant nearby liquidity zone. This level carried approximately 25.44K in liquidation leverage, making it the densest cluster above the current market price.
Such concentrations often attracted price because leveraged positions accumulated around them. As a result, the market could gravitate toward $0.2120 before deciding its next direction.
A move into this cluster would likely trigger liquidations that could accelerate short-term volatility and temporarily amplify buying pressure. On the other hand, failure to approach this area would leave the liquidity untapped and maintain focus on nearby support levels instead.
The current positioning therefore suggested that $0.2120 remained BUILDon’s immediate price magnet as traders monitored the next wave of leveraged activity.
Ultimately, BUILDon’s latest rally reflected strengthening buyer participation across both the spot and derivatives markets.
Rising trading volume, expanding OI, and improving technical indicators supported the recovery narrative, while the dense $0.2120 liquidation cluster established the market’s nearest upside attraction.
Current conditions favored another attempt toward that liquidity zone before the market determined whether the broader recovery could extend further.
Final Summary
- BUILDon regained bullish traction as volume and leveraged participation increased across the market.
- The $0.212 liquidity cluster now stands as the market’s nearest upside attraction.