Bullish HYPE’s short-term rally faces strong $21-resistance – Details
Swing traders remain bearish biased, despite Hyperliquid's 35% gains.

- Hyperliquid made strong gains over the past two weeks, but retained a bearish bias for swing traders
- Liquidity at $16.4 has served as a magnetic zone and attracted HYPE higher
The DEX token Hyperliquid [HYPE] registered gains of 35% in the last ten days. At press time, it had rebounded well from the $12 support and appeared to be heading towards the $18.5-$20 resistance zone. Bitcoin’s [BTC] slow move upwards from $78k to $84k over the same period certainly helped HYPE.
On the charts, the technical indicators flashed lower timeframe bullishness. Even so, the bearish outlook on the 1-day chart remained unchanged. A move beyond $21.25 would be necessary to mark a bullish structure shift.
Can HYPE advance to $21 from here?
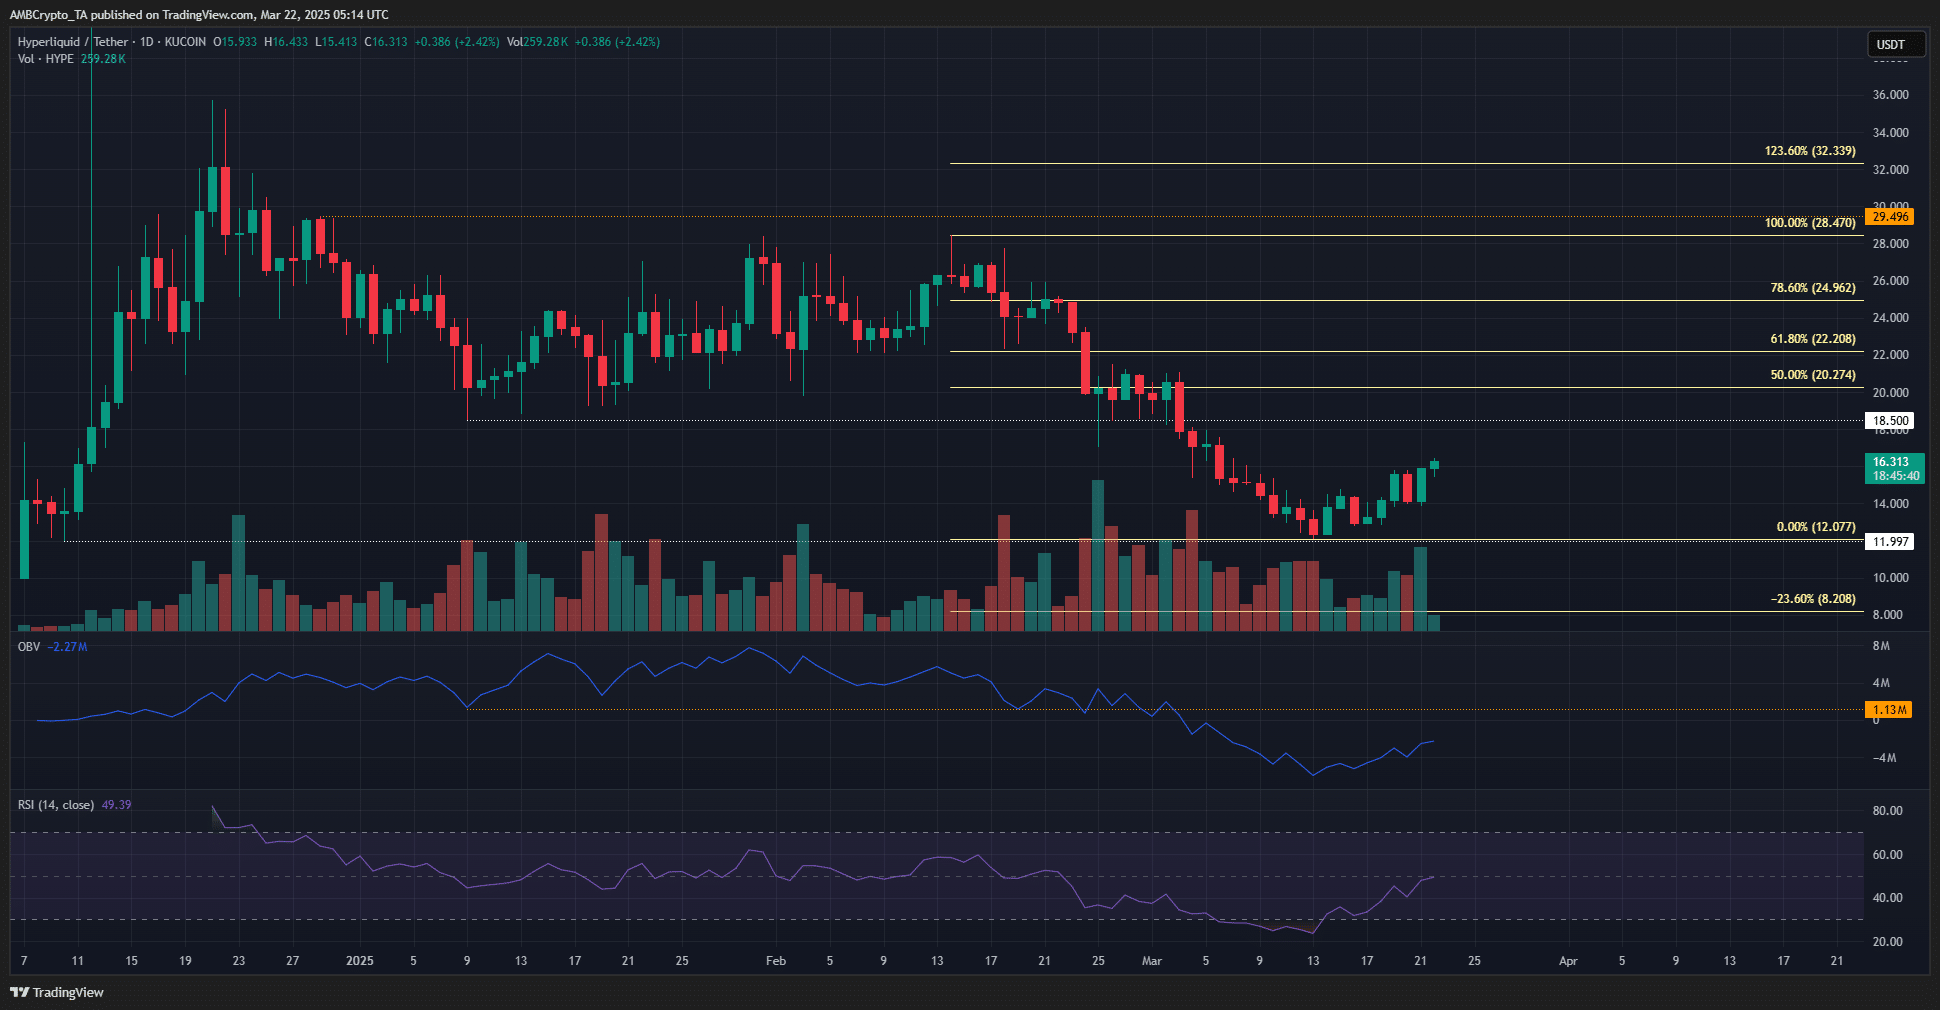
On the 1-day chart, the structure was strongly bearish. The latest lower high to beat seemed to be $21.25 – A zone of local resistance in late February. The $18.5-$21 region is expected to serve as resistance to Hyperliquid token prices.
Hence, a breakout beyond this region could take time to materialize. Until then, investors and swing traders can remain bearishly biased. The OBV has been climbing higher, but is yet to beat the support level from the first two months of 2025.
At the time of writing, the RSI was on the verge of climbing past neutral 50 to signal bullish momentum. The altcoin’s gains in recent days were encouraging though, and so was its trading volume.
The Fibonacci retracement levels revealed that the $20.74-level was the 50% retracement level. The $22.2-level can also be seen as a resistance. To the south, the continuation of the bearish trend could take the price to $8.2.
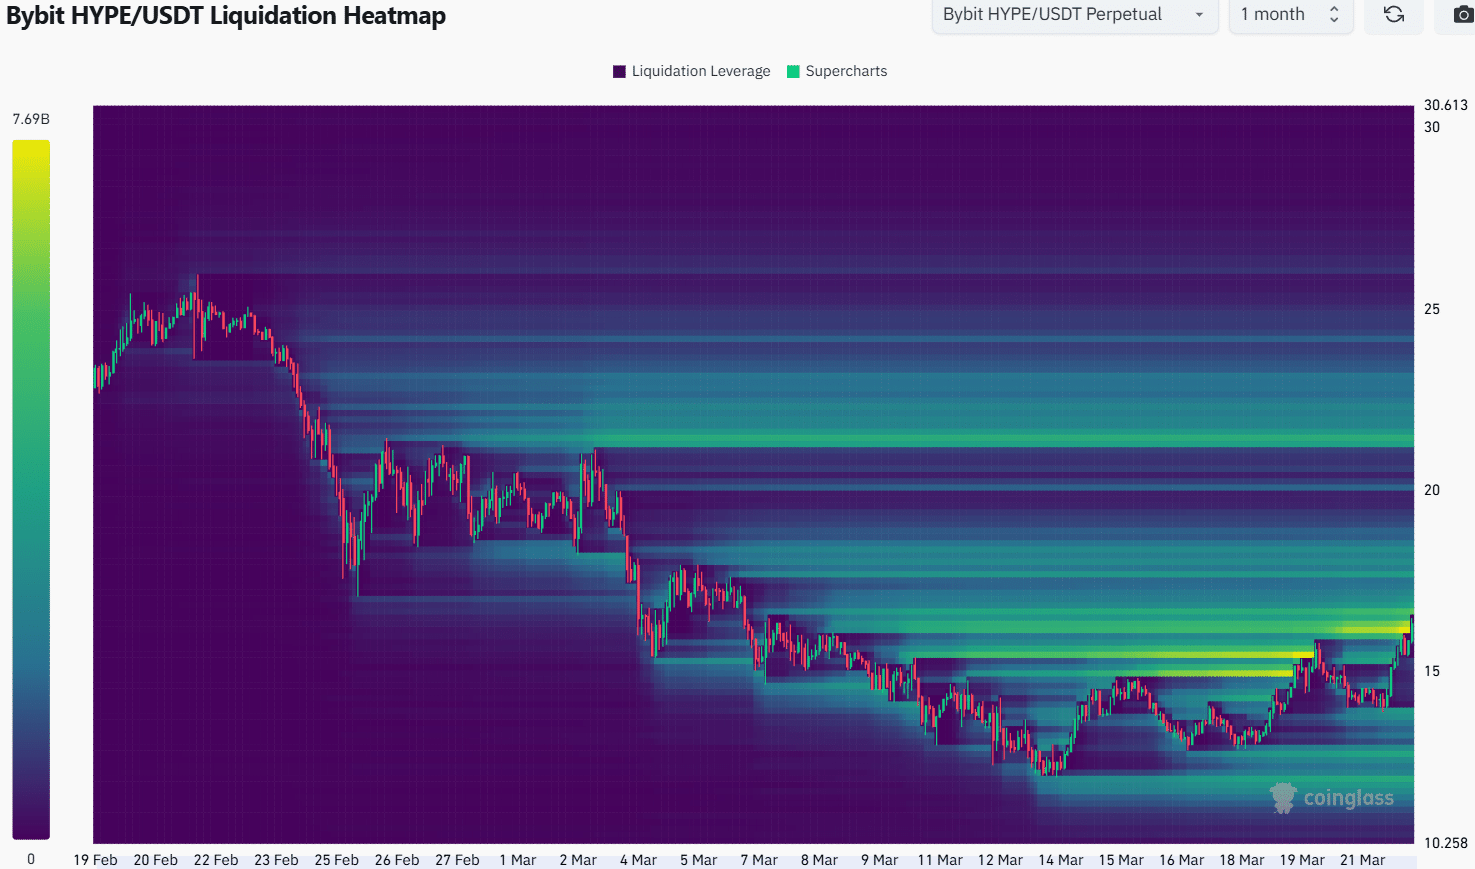
The 1-month liquidation heatmap highlighted that HYPE had just taken out a pocket of liquidity at $16.1-$16.4. It seemed ripe for a bearish reversal towards $13.7. However, the liquidity up to $18.3 could continue to pull the prices higher.
Overall, the chances of a sustained move higher appeared good for Hyperliquid. It may be likely to push towards $20-$21, but bulls should be wary of BTC’s price moves over the coming days.
Disclaimer: The information presented does not constitute financial, investment, trading, or other types of advice and is solely the writer’s opinion