- Shiba Inu’s 7-day burn rate declined to -84%.
- SHIB’s price has seen consecutive increases in value in the past three days.
Shiba Inu (SHIB) has been experiencing notable progress in various important areas, especially its price. As the price of SHIB has been on the rise, it reflected positive movement in several key metrics. However, amidst these upward trends, one particular metric has witnessed negative returns over the past few days. A cause for worry?
Read Shiba Inu (SHIB) Price Prediction 2022-23
Shiba Inu’s burn rate declines
Recent data revealed a noticeable decline in the burn rate of Shiba Inu. Information shared by Shibburn, a SHIB burn rate tracker, indicated that the burn rate decreased by more than 85% within the past seven days.
Additionally, according to the Shibburn site, only 360,222 SHIB tokens were burned in the past 24 hours, resulting in an almost -84% burn rate. Also, over 22 hours have lapsed since the last burn. This current burn rate departs from the consistent millions of SHIB tokens burned in previous instances.
Furthermore, a closer examination of the volume metric on Santiment sheds light on a potential cause of the burn rate decline. Analysis of the volume chart indicated a decline in SHIB trading volume.
As of this writing, the volume stood at approximately 64.6 million. It represented a significant decrease from the over 100 million volumes recorded around 11 June. This decline in volume implied a decrease in the number of SHIB transactions, thus contributing to the decrease in the burn rate.

Active addresses surge
Despite the decline in burn rate and trading volume, Shiba Inu experienced a notable increase in active addresses. According to the seven-day active addresses metric, SHIB active addresses began trending upward around 6 June, reaching the highest level in the past two months. As of this writing, there were over 77,000 active addresses.

Furthermore, there was a significant surge in daily active addresses on 15 June, surpassing 42,000. Before that, the daily active addresses hovered around 3,000. As of this writing, it decreased to approximately 8,200, which still exceeded the levels observed in April and May.
Realistic or not, here’s SHIB’s market cap in BTC terms
Shiba Inu sees consecutive price rise
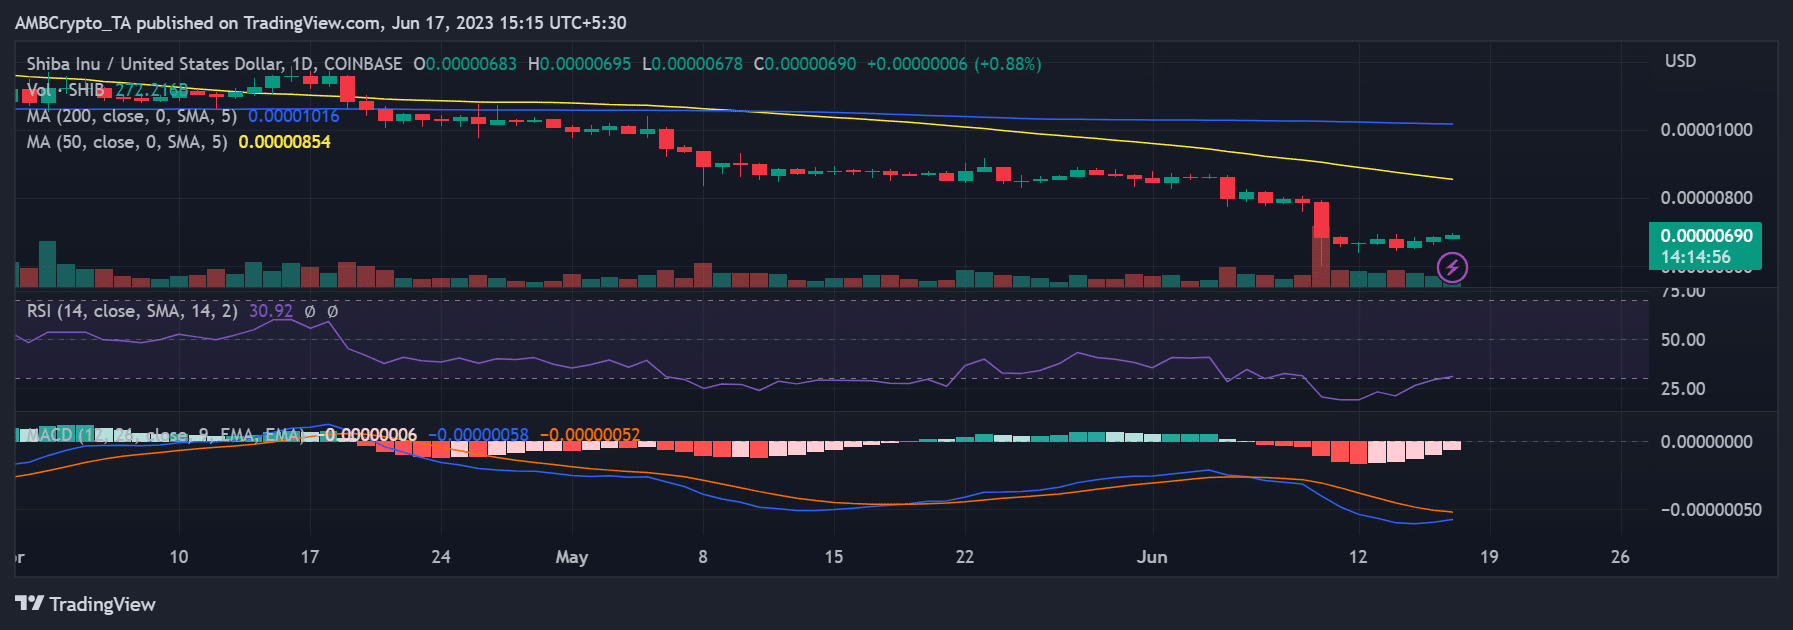
Shiba Inu has recently experienced a series of positive price movements on its daily timeframe chart. As of this writing, it gained nearly 1% in value, marking the third consecutive day of price increase.
However, it was still in a bearish trend, as indicated by the Moving Average Convergence Divergence (MACD). As of this writing, the MACD remained below 0, signaling a persistent bearish trend despite the ongoing uptrend in price.