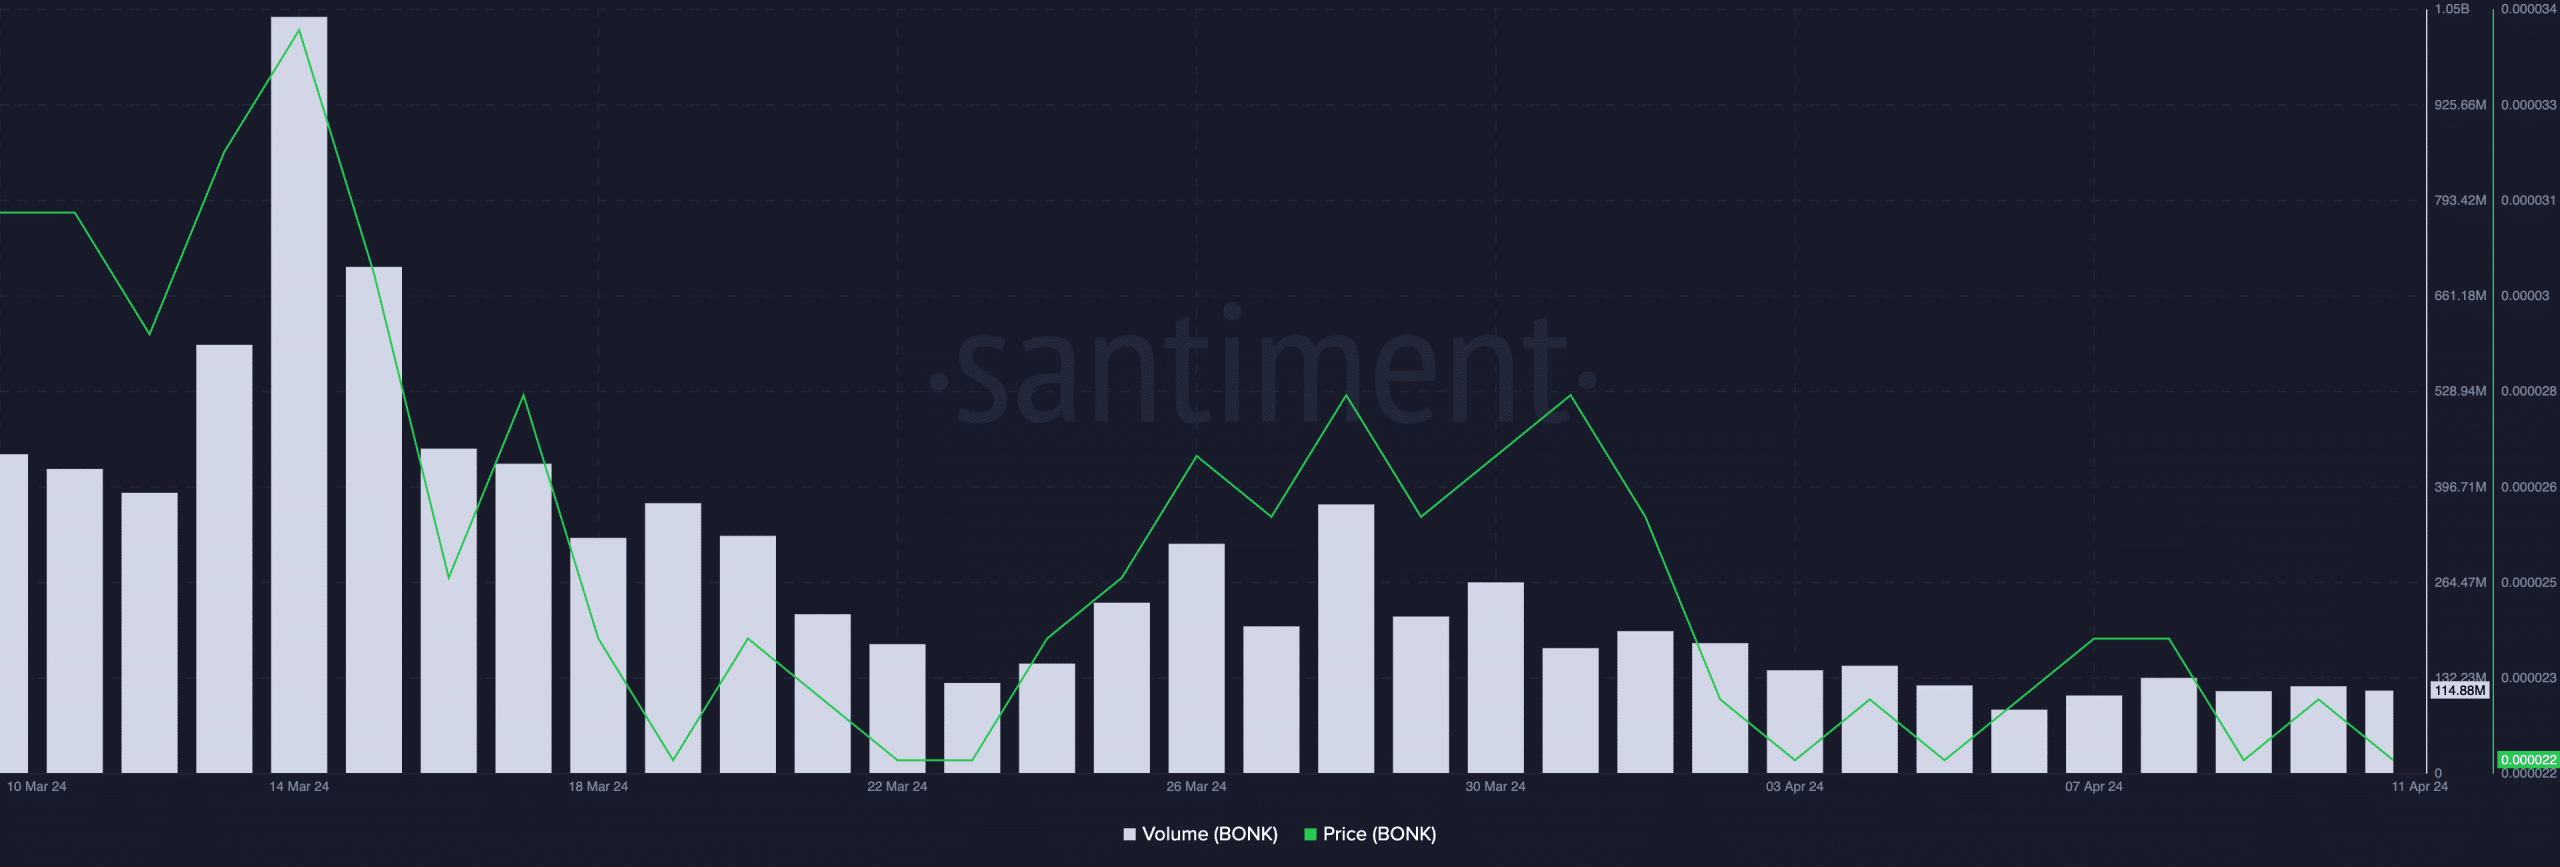
BONK trading volume crashed 73% – PEPE, WIF, FLOKI next?
BONK’s futures open interest has plummeted by over 25% in the last month. Price indicators hinted at a decline as well.

- BONK’s price has fallen by almost 30% in the last month.
- Readings from its price charts suggest the possibility of a further decrease.
Solana-based meme coin Bonk [BONK] bucks the trend and recorded a 27% price decline in the last month, despite the rally in the memecoin market during that period, CoinMarketCap’s data has shown.
The 30-day period under review has seen a significant fall in the token’s daily trading volume. According to Santiment’s data, BONK’s daily trading volume has fallen by 73% in the last month.
BONK to extend losses
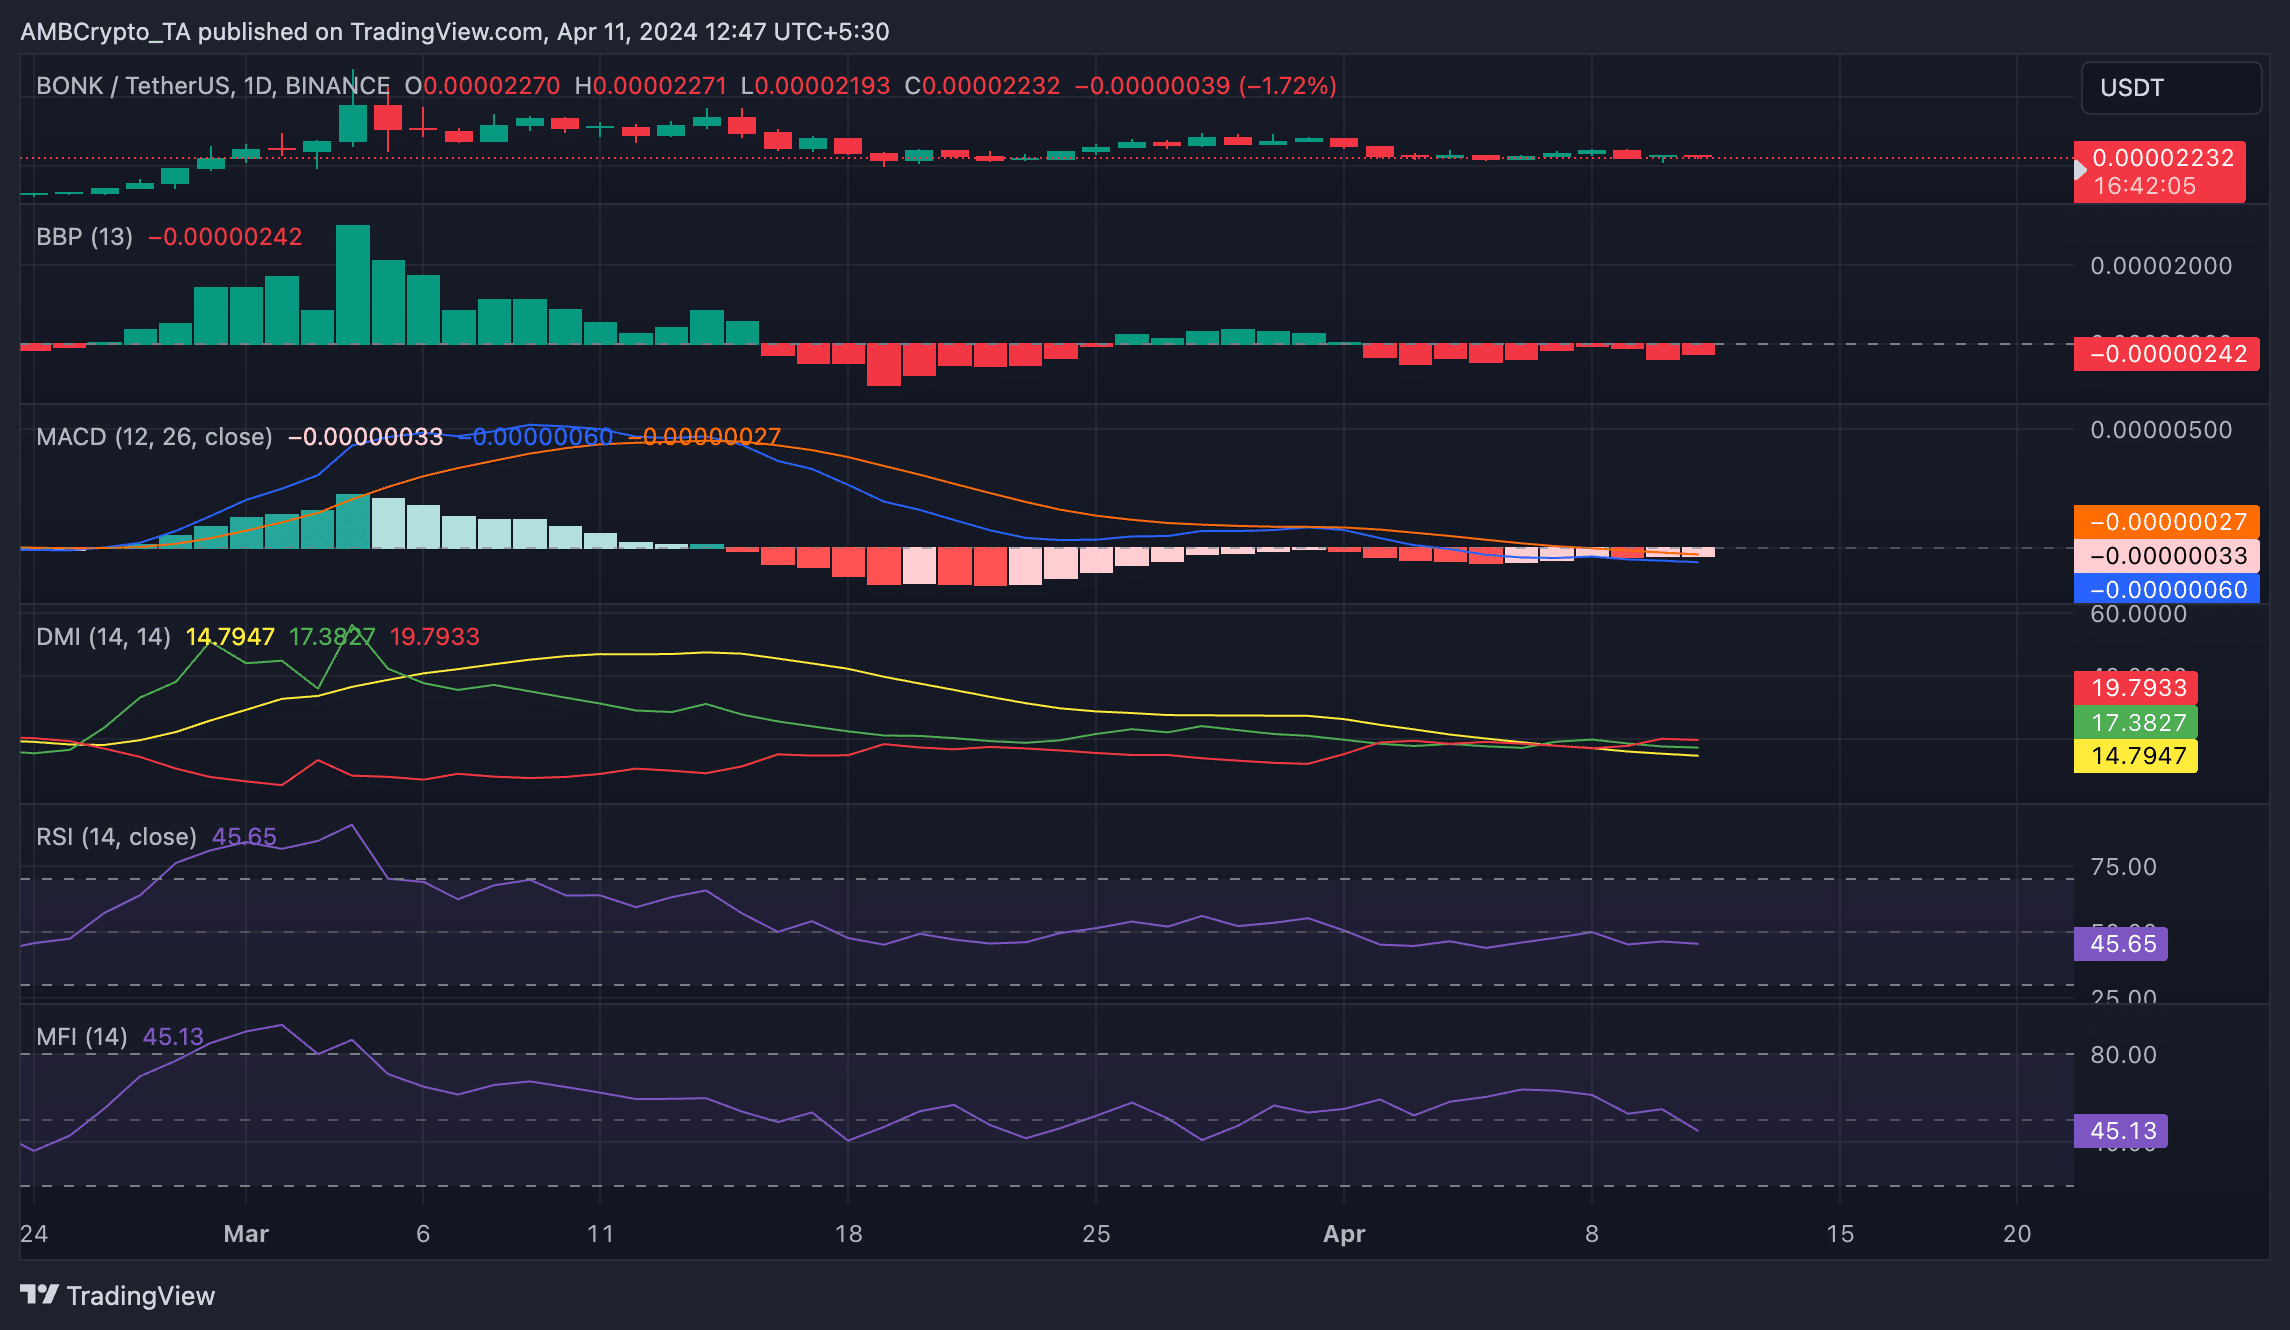
An assessment of BONK’s key technical indicators on a 1-day chart hinted at the possibility of a further decline in the memecoin’s value.
Signaling that bears are in control of the market, readings from its Directional Movement Index (DMI) showed its positive directional index (blue) resting below its negative index (red). These lines have been so positioned since 9th April.
When an asset’s DMI is set up this way, it suggests that its downward price movement is stronger than any potential for an upward correction.
Further, the altcoin’s key momentum indicators were spotted below their respective neutral lines at the time of writing. BONK’s Relative Strength Index (RSI) was 45.28, and its Money Flow Index (MFI) was 45.09.
These values showed that BONK distribution outpaced its accumulation, thereby putting downward pressure on its price.
In addition, its Elder-Ray Index has posted only negative values since 2nd April. This indicator measures the relationship between the strength of buyers and sellers in the market.
When its value is negative, it means there is an uptick in selling activity as bear power becomes more significant.
Confirming the strength of the bears, BONK’s MACD line was below the signal and zero lines as of this writing.
When an asset’s MACD line falls below its signal line and returns a negative value, it is a bearish signal. This suggests that its short-term trend is weaker than its longer-term trend. Traders take this as a sign to exit long positions and take short ones.
Is your portfolio green? Check the Bonk Profit Calculator
Traders refuse to relent
In BONK’s derivatives market, its futures open interest has cratered by 65% since 5th March, per Coinglass data. However, despite this decline, its funding rate across cryptocurrency exchanges has remained positive.
This suggests that futures market participants have continued to take long positions in anticipation of an uptrend.


