- ApeCoin’s recent price action chalked out a descending channel pattern on its daily chart.
- The altcoin’s derivatives data showed a clear bearish edge, with the long/short ratio on Binance reigniting some recovery hopes for buyers.
ApeCoin [APE] has been under sustained selling pressure, continuing its downward trajectory as the bears maintained their grip on the market.
The crypto’s recent price action suggested that sellers have been in control, with APE struggling to find support at key levels.
After witnessing an uptrend in March this year, APE has seen a consistent decline on its charts and hit its all-time low on the 5th of August at $0.473.
The price recently formed a descending channel, indicating the potential for a trend reversal. At press time, APE was trading at $0.602, down by around 2.5% in the last 24 hours.
ApeCoin bears continue to exert pressure
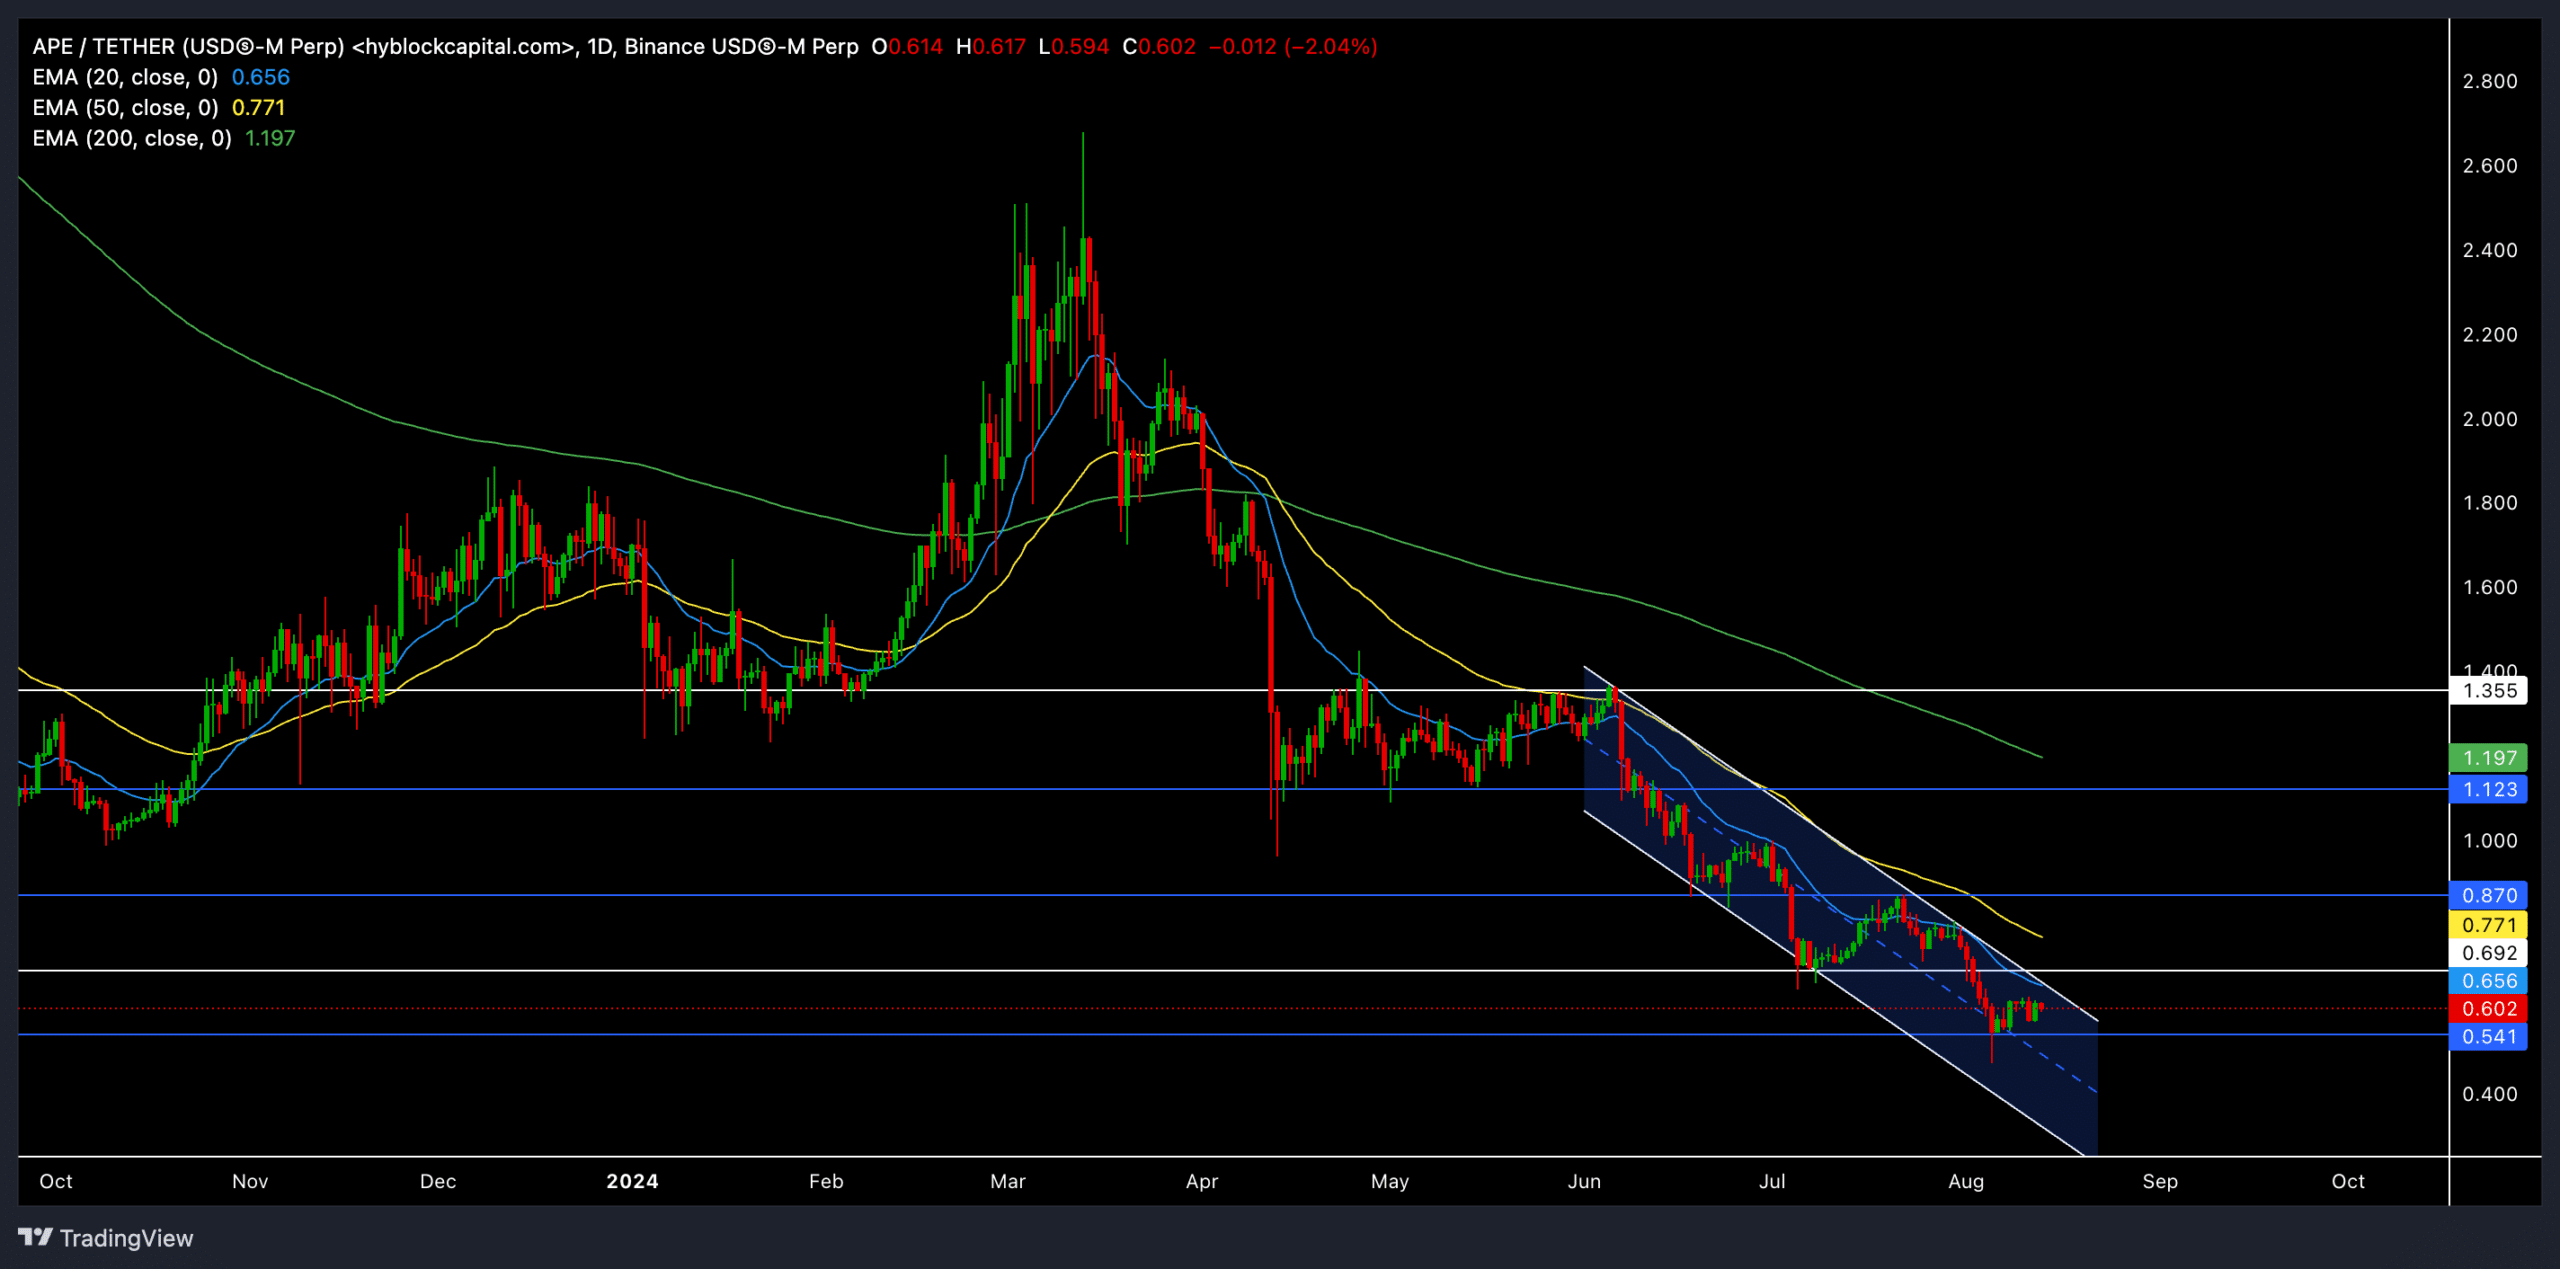
Source: TradingView APE/USDT
The 20-day EMA (Exponential Moving Average) and the 50-day EMA stood at $0.656 and $0.771, respectively. Both trended downward, confirming strong bearish momentum.
The 200-day EMA, at $1.197, was far above the current price, further reaffirming the bearish sentiment.
It’s worth noting that the MACD (Moving Average Convergence Divergence) indicator was also in bearish territory, with both the MACD line and the signal line below the zero mark.
The histogram showed a slight decrease in bearish momentum, suggesting that the selling pressure might ease.
For a bullish reversal, APE needs to reclaim and sustain above the 20-day EMA. A move above this level could encourage more buying and potentially lead to a test of the $0.87 resistance.
However, given the current market conditions and the downward momentum, this scenario seems less likely in the near term.
The Relative Strength Index (RSI) hovered near the oversold region, which might indicate the potential for a rebound.
Key levels to watch
The immediate support level is at $0.541, where the price might see some buying interest.
However, if the bears continue to dominate, a break below this level could lead APE into uncharted territory, with the first major support at $0.35.
On the upside, if the bulls manage to push the price above the 20 EMA, we could see a short-term rally towards the $0.771 and $0.87 resistance levels.
Can the bulls stage a comeback?

Source: Coinglass
PER AMBCrypto’s looking at the derivatives data, the overall volume has decreased by 23.36% and Open Interest has dropped by 3.11%, indicating that traders were reducing their positions in APE.
The long/short ratio for the last 24 hours stood at 0.9205, suggesting a slight bearish bias among traders.
Is your portfolio green? Check out the APE Profit Calculator
However, the Binance APE/USDT long/short ratio is at 2.427, showing that a significant number of traders on Binance are betting on a potential reversal.
Buyers should also consider Bitcoin’s movement and overall market sentiment before making any trading decisions.
Disclaimer: The information presented does not constitute financial, investment, trading, or other types of advice and is solely the writer’s opinion.