
Ethereum – How an 8% supply squeeze is pushing ETH towards price discovery
- Bitcoin has a strong bullish bias this week.
- The recent dip might be to engineer liquidity and more volatility was likely.
Bitcoin [BTC] was trading at the range highs at $67 at press time. This range has been in place since mid-April. The past few days’ momentum, particularly the recovery past $65k, convinced bulls that further gains were likely.
Other signals from on-chain analysis highlighted bullish sentiment in the market. Yet, the liquidity in the $68k-$69k region could see a bearish reversal. What are the chances that this scenario would play out?
How liquidity runs can be engineered
Crypto analyst CrypNuevo pointed out in a post on X (formerly Twitter) that the $69k region had a large cluster of liquidation levels. This level could attract prices in the coming days, but it could be accompanied by some volatility.
The idea is that a sharp, quick downward move before this large liquidity pocket is hit could encourage more short positions. It could also create false confidence in traders who are already short, which builds even more liquidity around the $69k region.
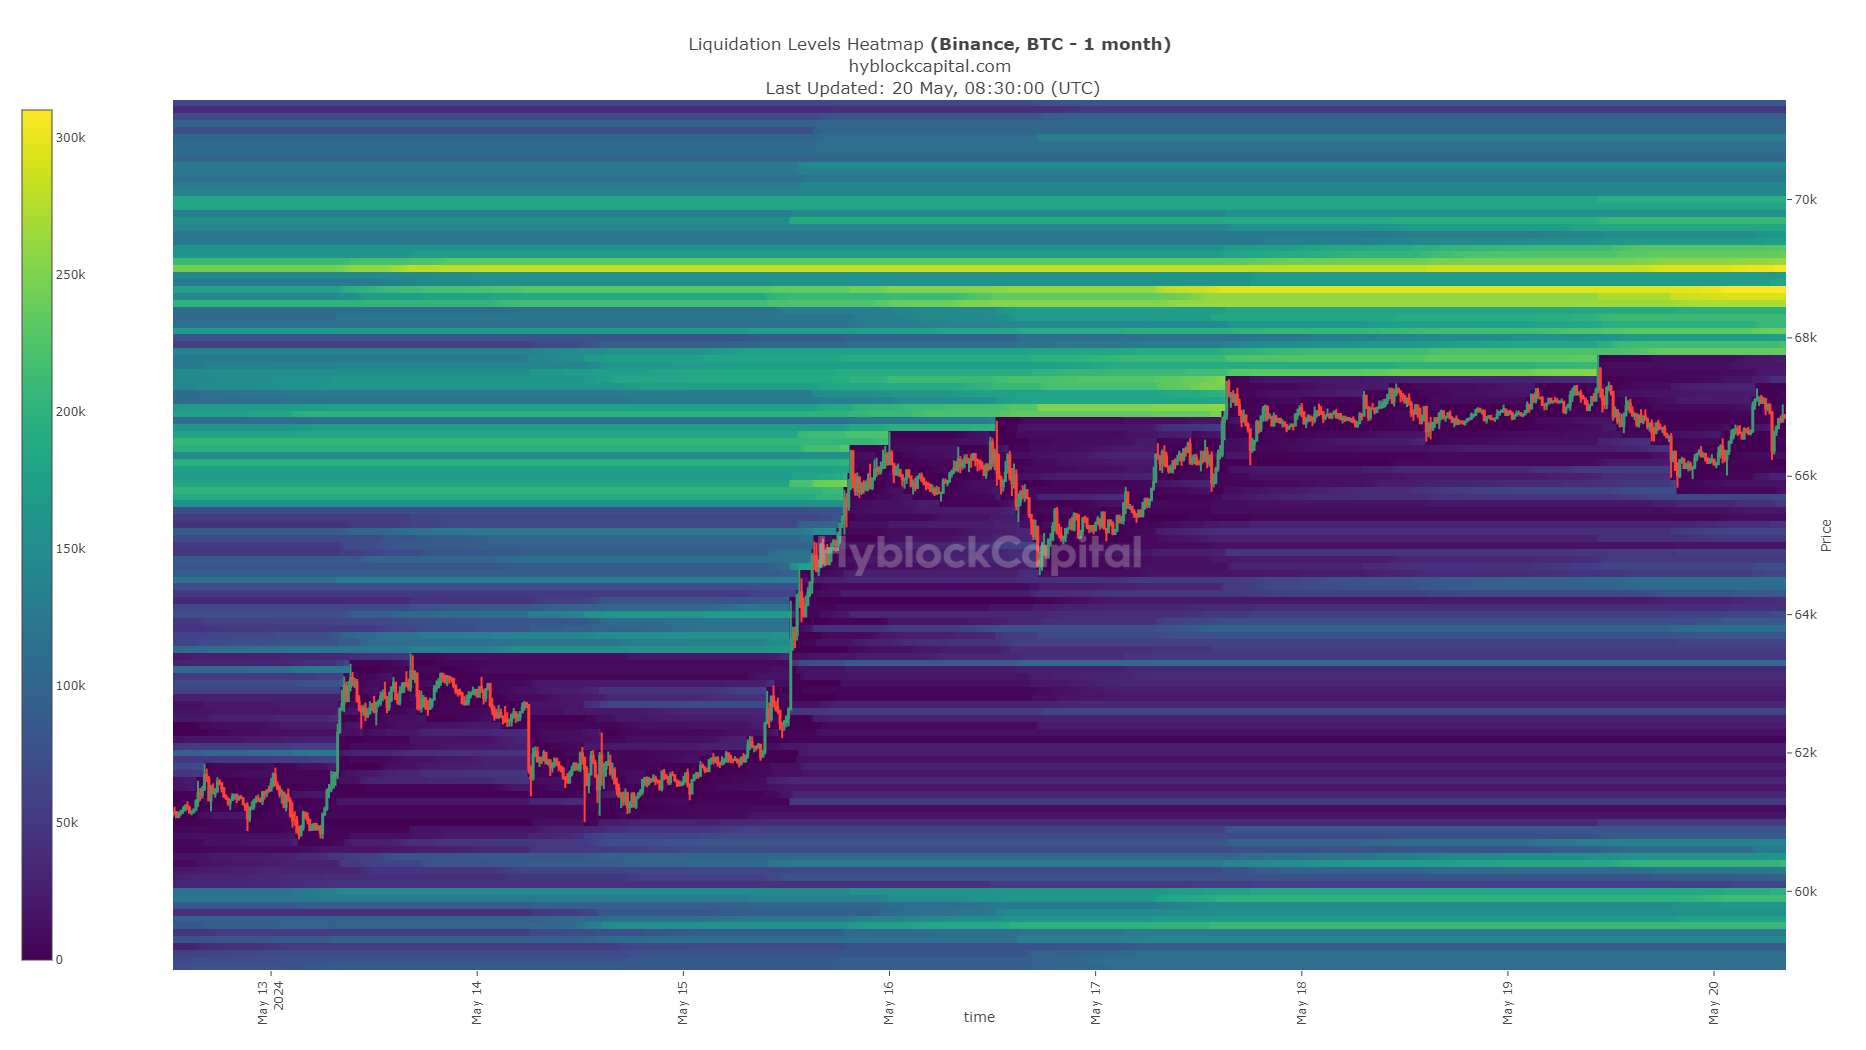
Source: Hyblock
He also pointed out that these aggressive moves happen at the start of the week. The 50-EMA on the 4-hour chart at $65k was another potential support for Bitcoin. Such a deep drop could encourage even more short-selling.
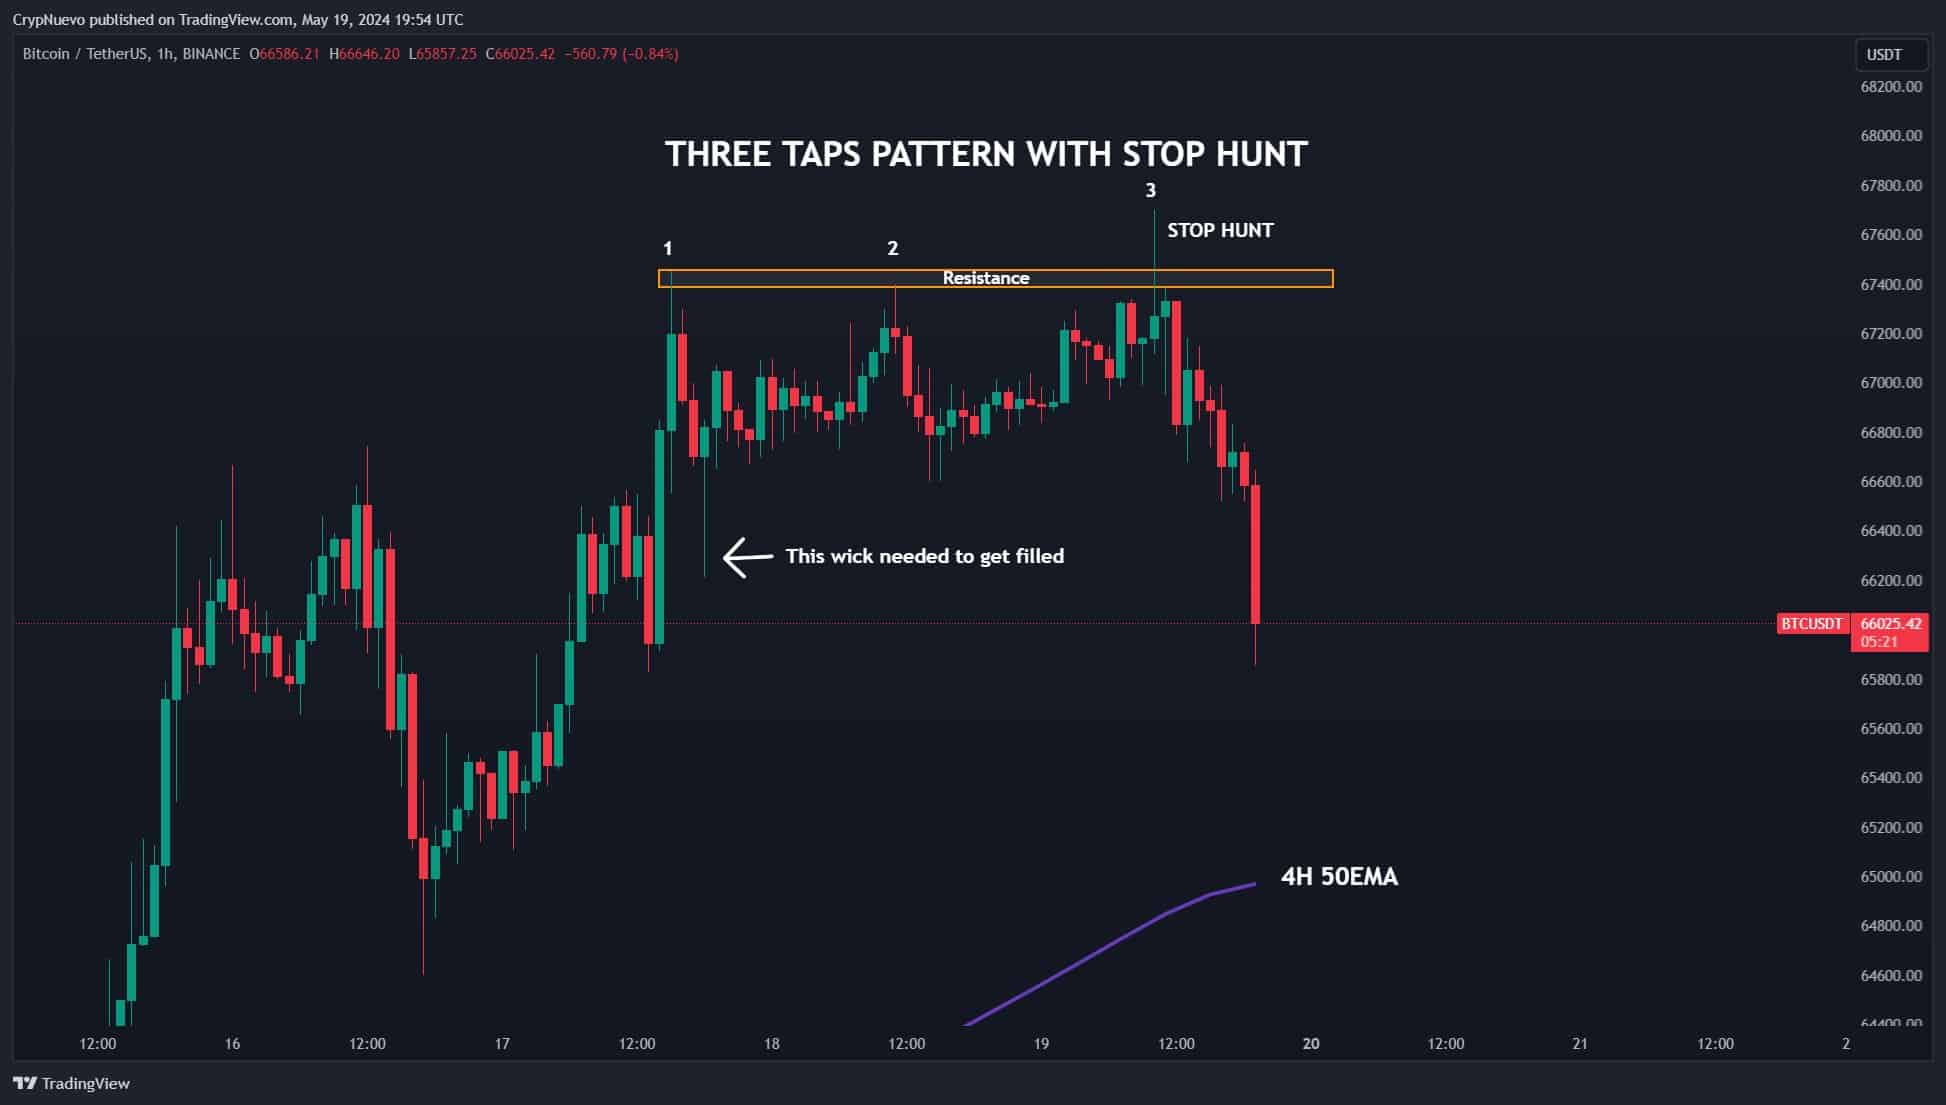
Source: CrypNuevo on X
However, the liquidation heatmap showcased the $68.6k-$69.2k as a critical resistance zone. The analyst expects a drop to $65k this week, followed by a rally to $69k.
What does the 4-hour timeframe technical analysis reveal?
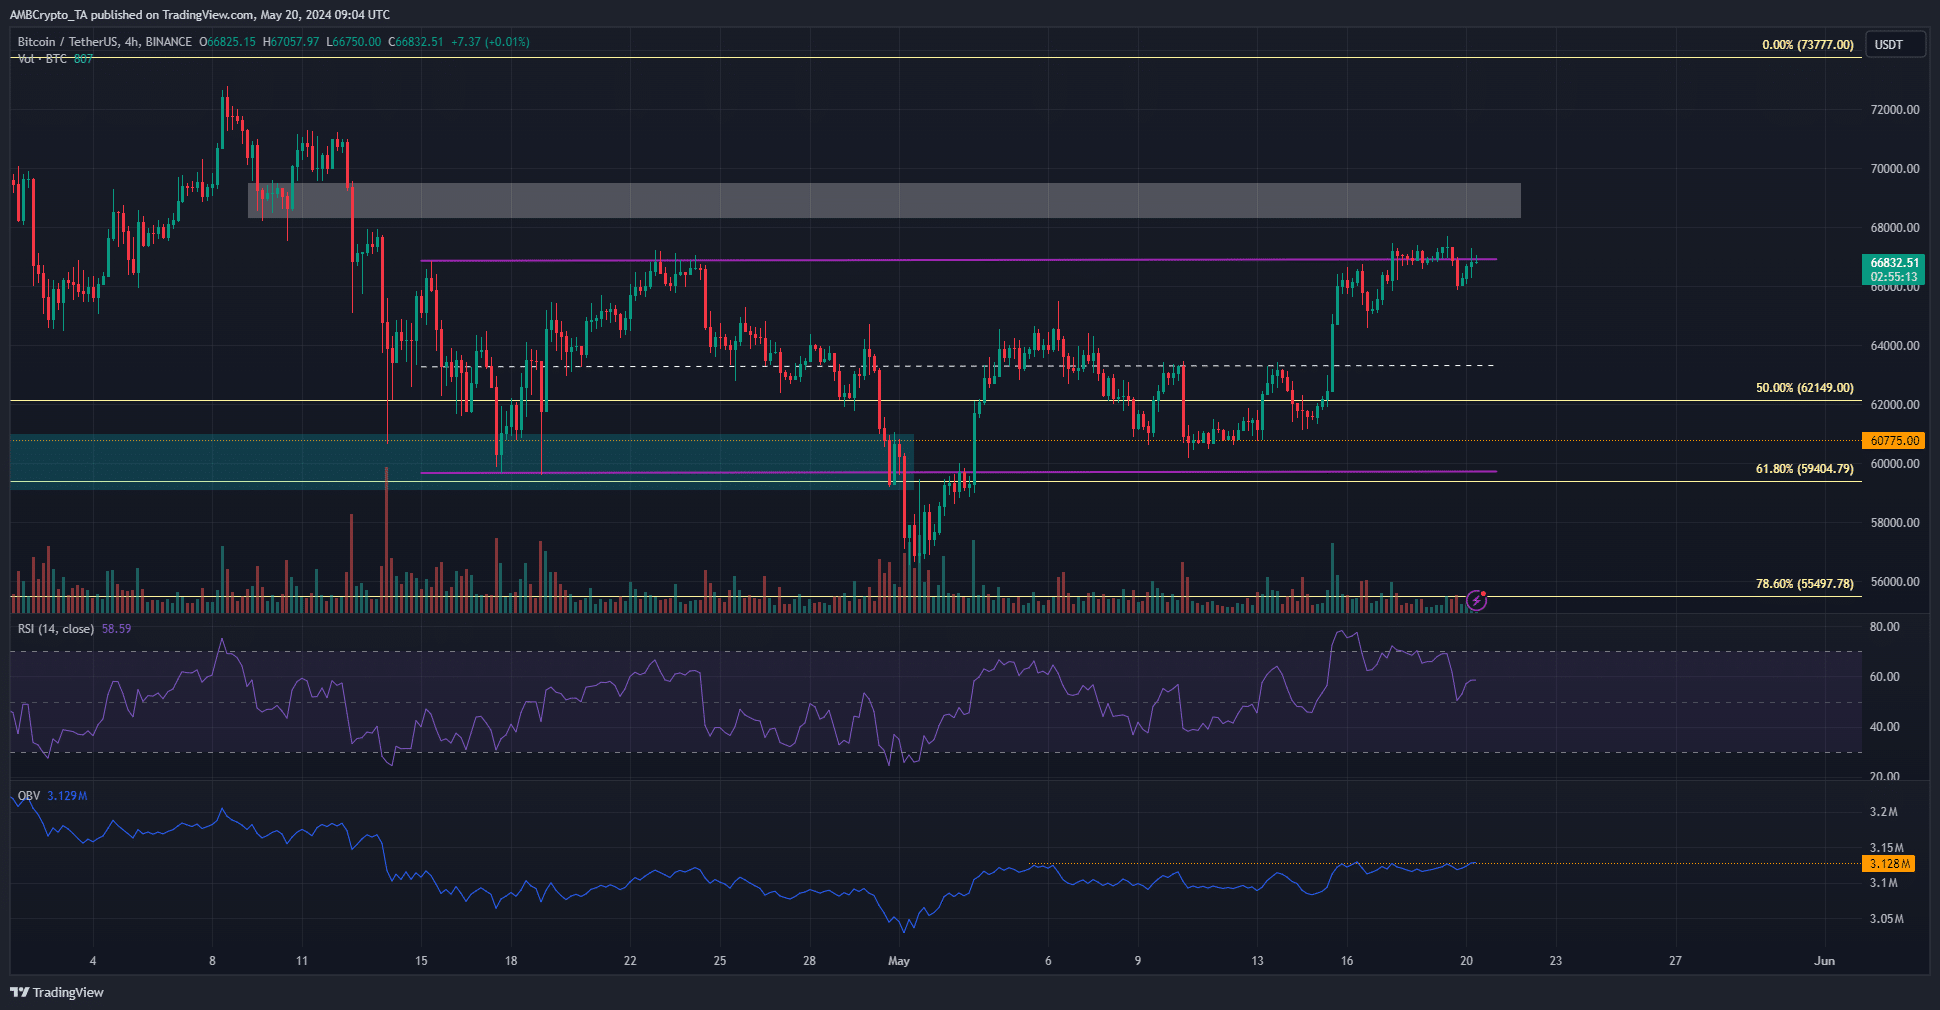
Source: BTC/USDT on TradingView
The H4 RSI continued to move above neutral 50 and indicated strong bullish momentum. Yet, the BTC trading volume has been low since Friday. However, the OBV was on the verge of clearing a local resistance level, which could add to the bullish impetus.
Is your portfolio green? Check the Bitcoin Profit Calculator
The 4-hour chart revealed strong resistance at $69k-$69.5k, but short liquidations could fuel a surge past this tricky resistance zone.
Hence, traders should be prepared for some volatility but continued bullish progress this week.
Disclaimer: The information presented does not constitute financial, investment, trading, or other types of advice and is solely the writer’s opinion.


