Can Bitcoin’s 370K new wallets save BTC’s price from falling below $65,000?
Ahead of the next halving event, Bitcoin has seen a spike in its number of addresses holding at least one coin.

- There has been a growth in new demand for BTC over the past week
- The last 12 hours have seen a decline in the same though
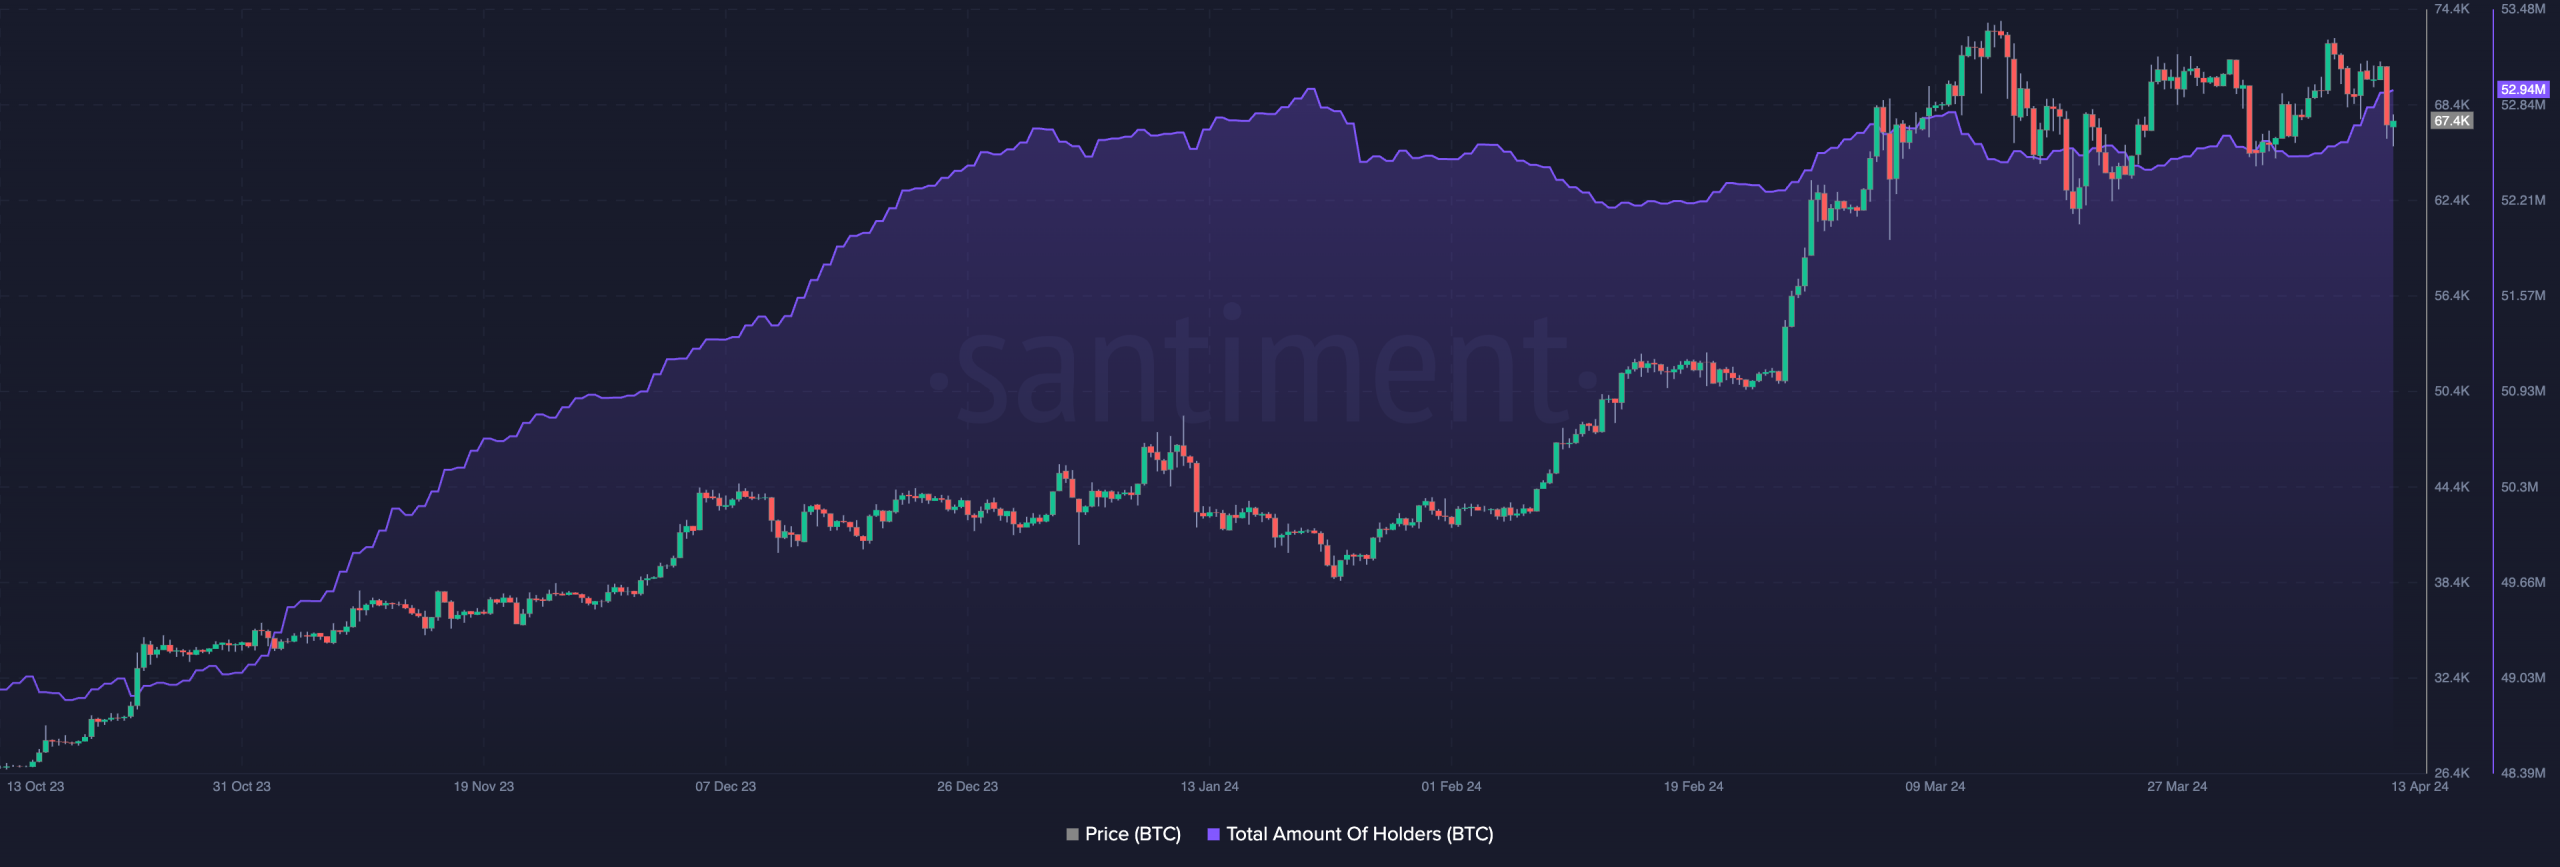
The count of Bitcoin’s [BTC] non-zero wallets has risen, despite the recent pullbacks in the coin’s price, according to Santiment’s data.
According to the on-chain data provider, 370,000 new wallets holding at least one BTC have been created in the last six days. The number of BTC holders now totals 52.94 million, growing by 0.1% since the beginning of the year.
At press time, BTC was trading at $67,734. Owing to negativity across traditional markets and the geopolitical uncertainty, the cryptocurrency fell on the charts and took the rest of the market down with it. It was down by over 5% in the last 24 hours, according to CoinMarketCap’s data.
More decline in the short term?
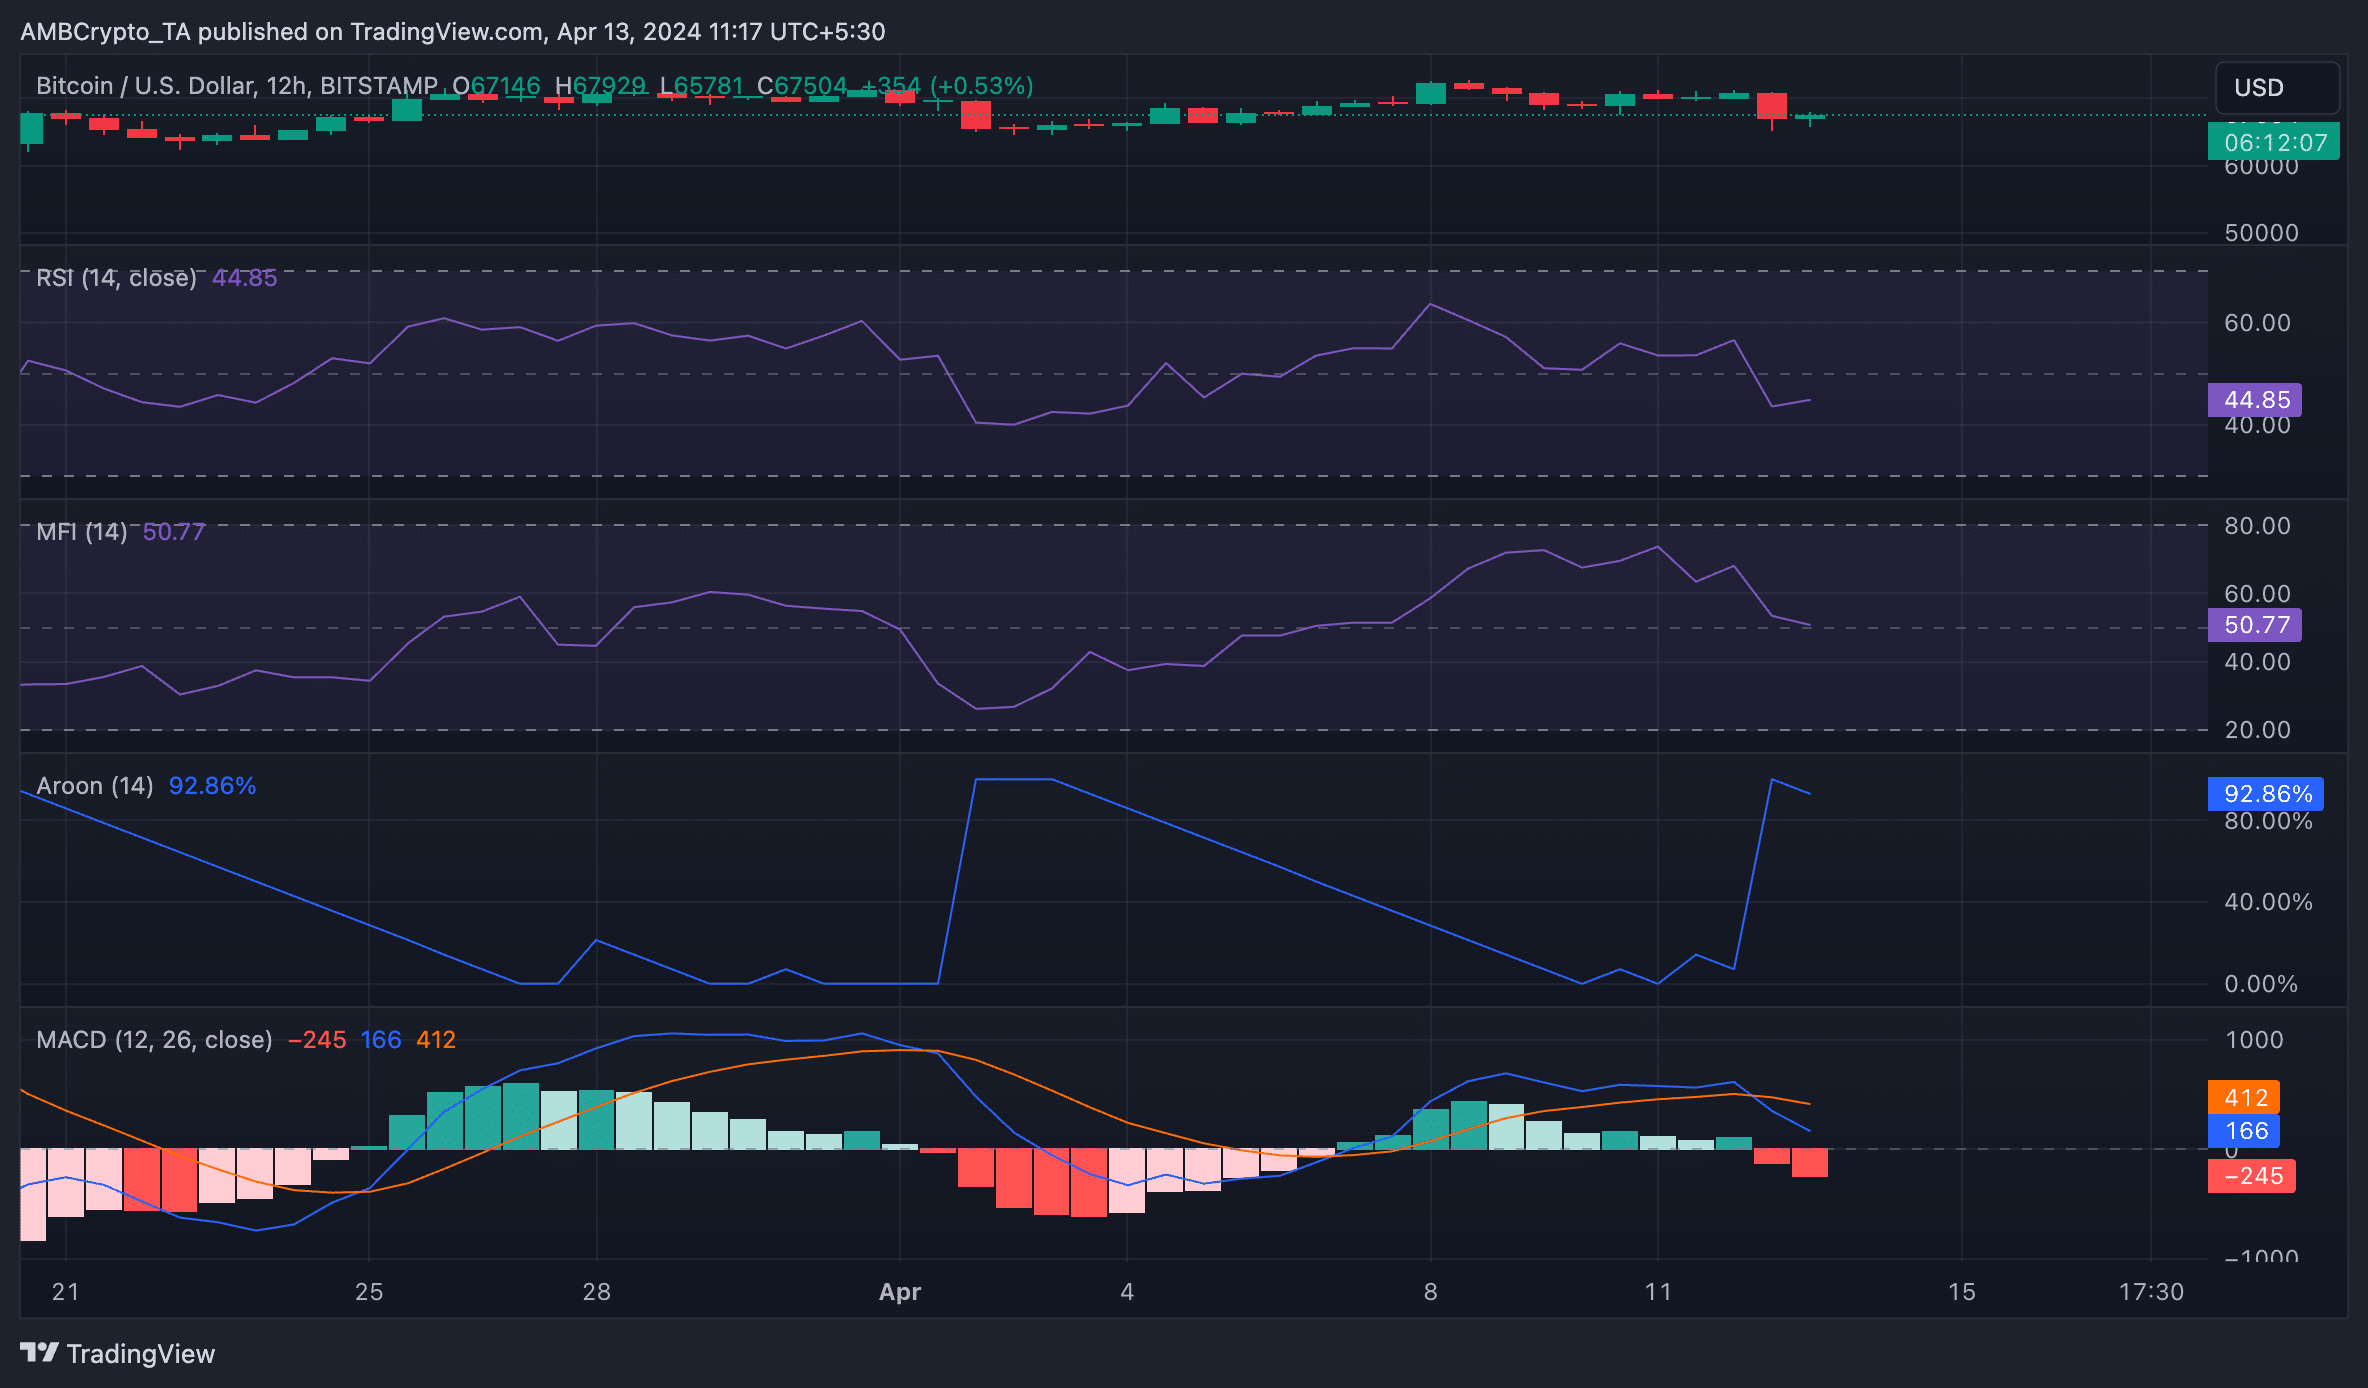
An assessment of the coin’s performance on the daily chart hinted at the possibility of a further price downside in the short term. Key indicators observed confirmed that bearish activity significantly outpaced bullish trends in BTC’s market. If the crypto’s market depreciates even more, $65,000 could be on the cards for BTC too.
For example, its Aroon Down Line (blue) had a reading of 92.86% at press time. An asset’s Aroon indicator measures its trend strength and identifies potential reversal points in its price movement. When the Aroon Down line is close to 100, as in this case, it indicates that the downtrend is strong and that the most recent low was reached relatively recently.
According to CoinMarketCap data, BTC last traded around the $67,000-zone a month ago.
Is your portfolio green? Check out the Bitcoin Profit Calculator
Confirming the bearish trend in the coin’s market, during the intraday trading session on 12th April, the coin’s MACD crossed below its signal line.
When an asset’s MACD line intersects its signal line this way, it indicates that the short-term trend is weakening relative to the longer-term trend. It has been known to precede a downtrend in price. Traders often interpret it as a sign to consider selling their holdings or taking short positions.
As expected, with Bitcoin’s price falling as it did, there has been a pullback in general demand for the coin too. The same was underlined by the findings of the Relative Strength Index and the Money Flow Index, with the latter all set to cross the mid-line at press time – A very bearish sign.
The values of these indicators revealed that market participants are favoring BTC distribution over accumulation right now. Ergo, it’s too soon to say whether the cryptocurrency will go on a sustained uptrend now, even as the Halving looms closer.