Can Bitcoin’s price stay at $82K? A week of macro data will decide
A bull market is underway, and a price dip below $80k will offer a buying opportunity.



Bitcoin [BTC] market participants need to prepare for another week of macro events that could dictate price trends and sentiment shifts. On the 29th of September, the August JOLTS (Job Openings and Labor Turnover Survey) data will be released.
It is August’s Personal Consumption Expenditures (PCE) inflation on Wednesday, September ISM manufacturing on Thursday, and September jobs data on Friday, reported XWIN Japan on CryptoQuant.
These reports can have a material effect on the October rate hike odds, which currently stand at a 68.1% probability of a 25 bps hike, according to the CME FedWatch Tool.
Bitcoin is up 43.8% from the $57.8k June low, which might be the bear cycle low. Can BTC defend the $82k demand zone, or will a weak macro outlook force a bigger sell-off?
Is the Bitcoin price correction over?
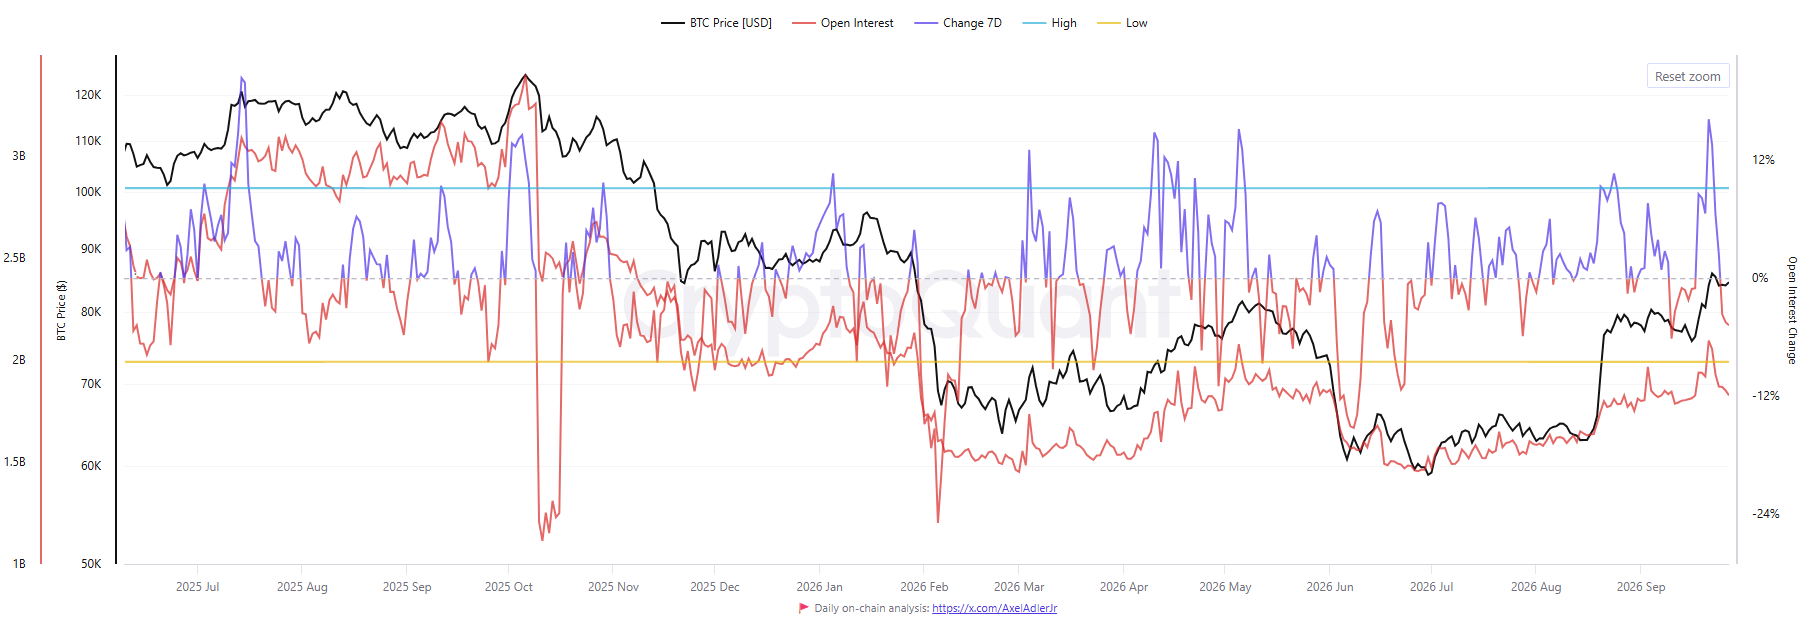
The Futures Open Interest Percent Change Oscillator measures the rate of change in OI, rather than tracking the raw nominal OI. This rate of change helps pinpoint market phases of overheating in speculative buildup and when leverage flushes occur.
When the oscillator falls below the low (yellow) at -8.5%, it tends to signal an end to a local correction.
Over the past few days, the metric has dipped toward the September 10 lows of -6.16% and was at -4.8% at the time of writing.
It was not definitive proof that the correction has ended, but Bitcoin is getting there.
Further drawdown remains a possibility
On the 4-hour chart, we can see that the $85k area has become a local supply zone. The $83k area was being tested as support. Failure to stay above $82,850 would likely mean a deeper retracement below $80k is possible.
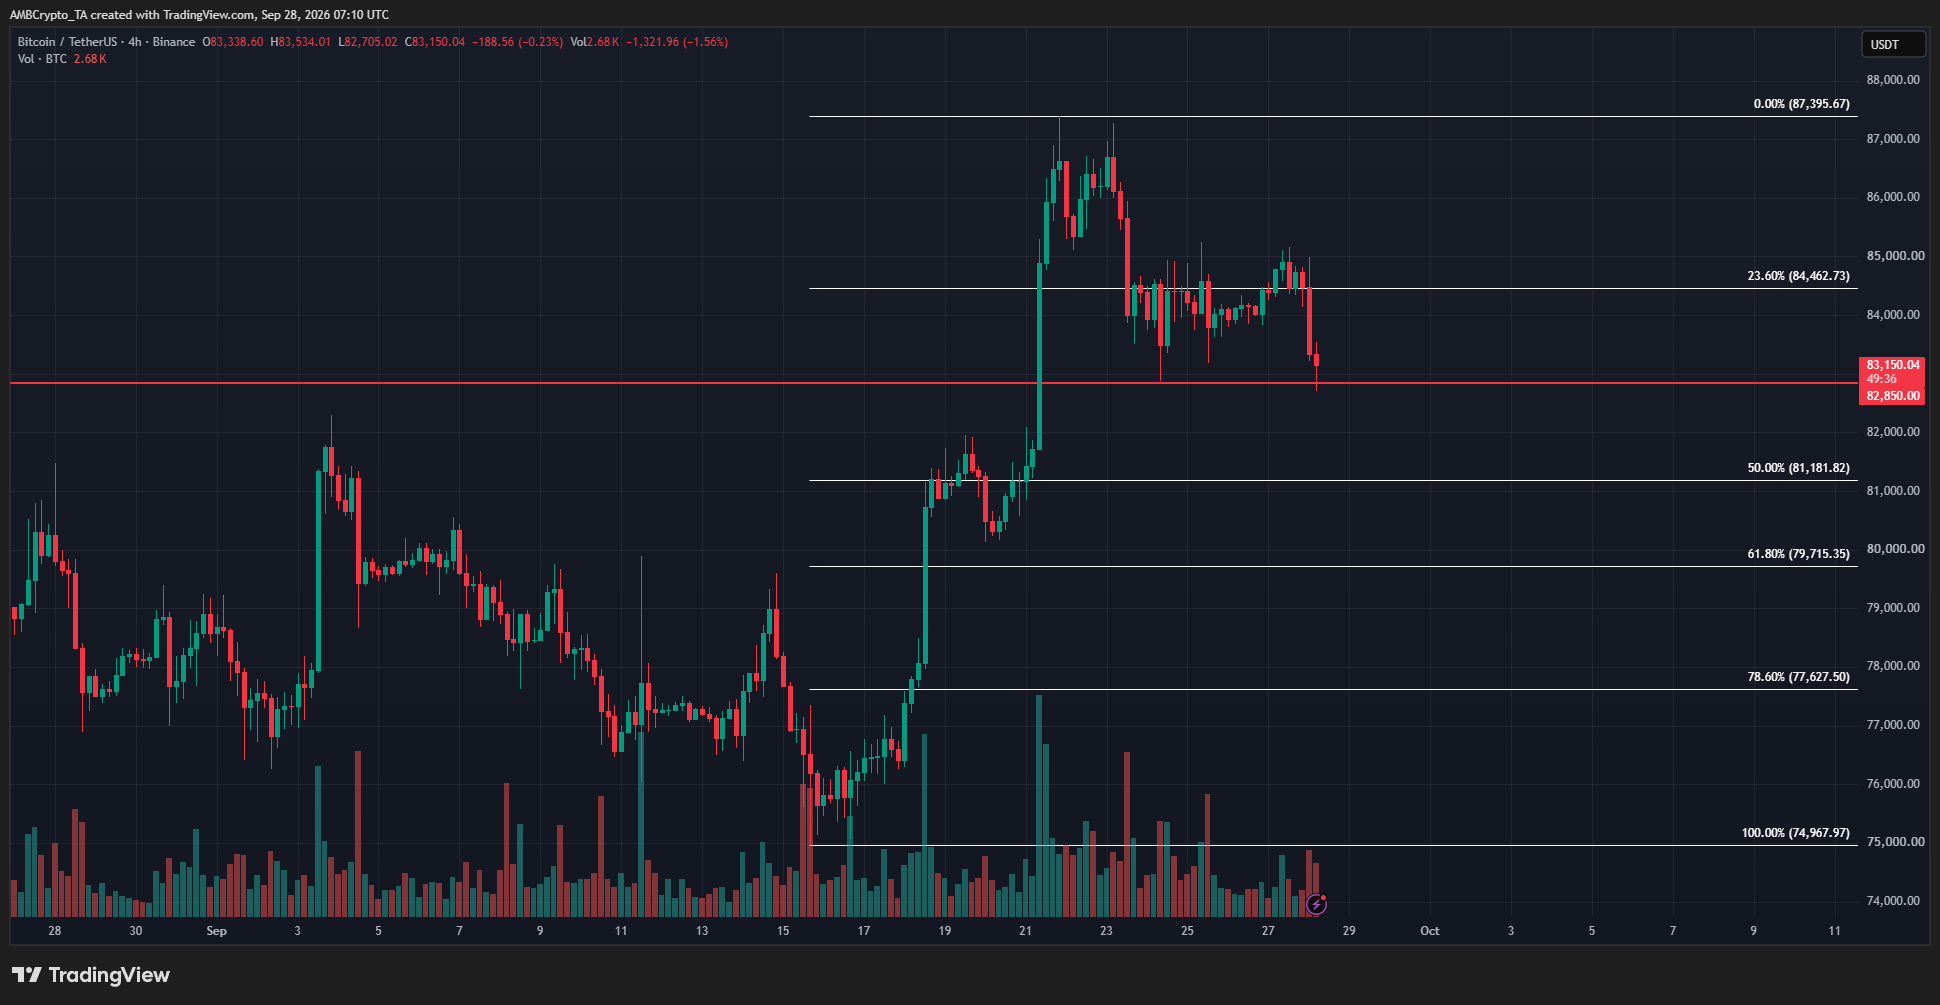
A correction below $80k would not invalidate the market structure. As things stand, a drop below $74,967 is needed to flip the H4 swing structure bearishly, but a dip below $82,874 would signal a short-term bearish shift.
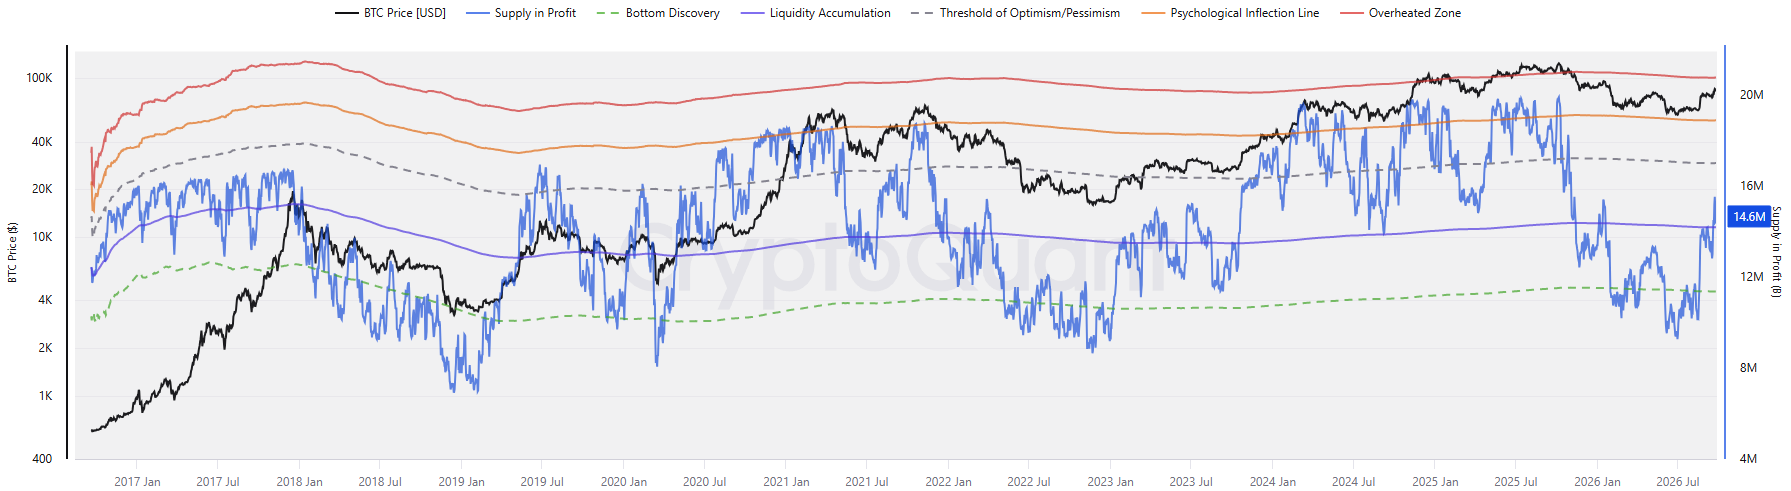
The Supply in Profit Market Bands metric by Axel Adler Jr. showed that the bottom discovery phase was already done. The supply in profit, in BTC, was 14.6 million, above the liquidity accumulation threshold of 14.175 million.
Comparing the trends with 2022-23, it appeared that the market was once again in an early bullish phase to bullish phase.
Final Summary
- The Bitcoin price trends have been relatively flat over the past five days amid an ongoing correction.
- The on-chain metrics and price action showed that a bull market was underway, and a price dip below $80k would offer a buying opportunity.