Can BNB reclaim $780? THESE levels stand between Binance Coin and $1K
The Binance Coin long-term trend has shifted bullishly following the break of the $745 resistance.



A week ago, Binance Coin [BNB] rallied to $780, breaking above the May high at $745. It was part of the steady upward push that the bulls have maintained since late July.
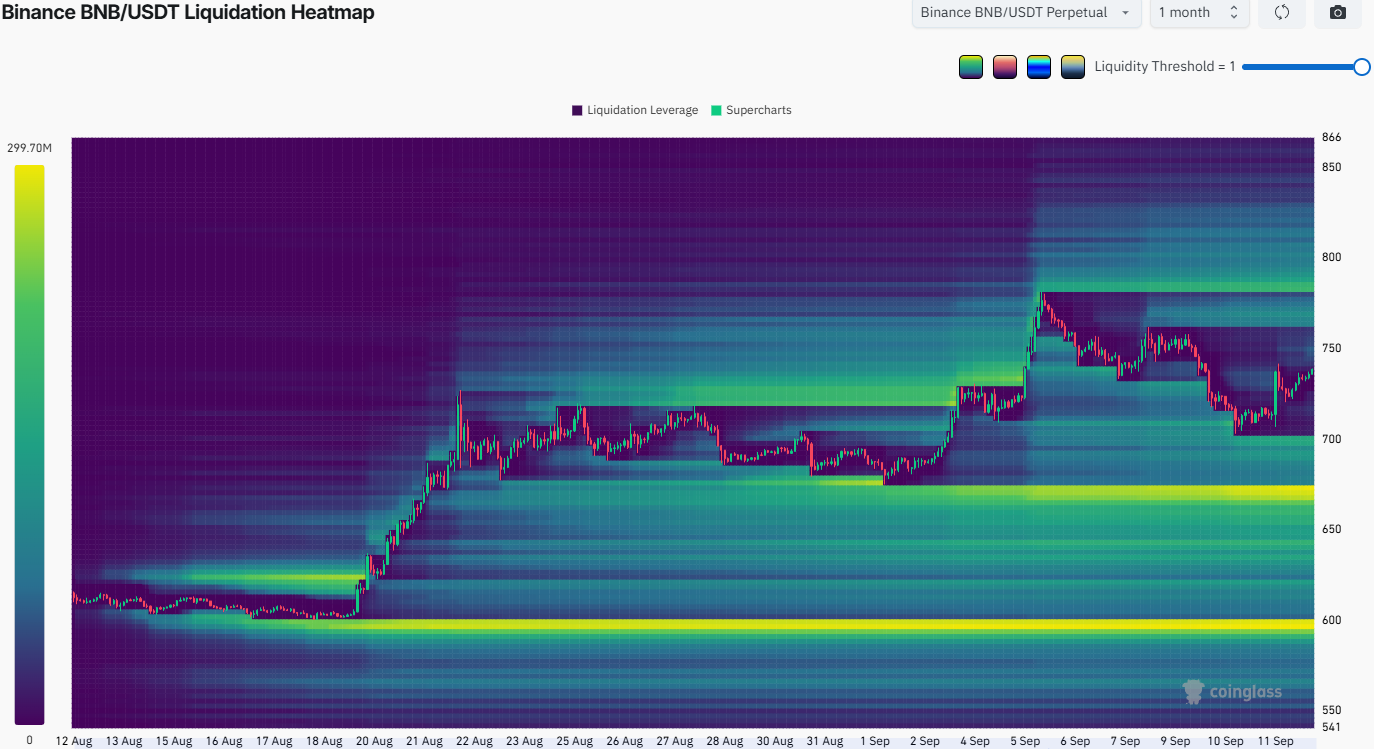
Last week’s rally caused a sizeable amount of short liquidations on its way to $780, the liquidation heatmap showed. The retracement since then has space to go further south. The next magnetic zones were at $700 and $670.
A reading of the price charts of Binance Coin across multiple timeframes showed that, provided Bitcoin [BTC] does not see a massive sell-off, BNB could be flashing a buy signal.
The importance of the $745 level and where the next immediate support lies
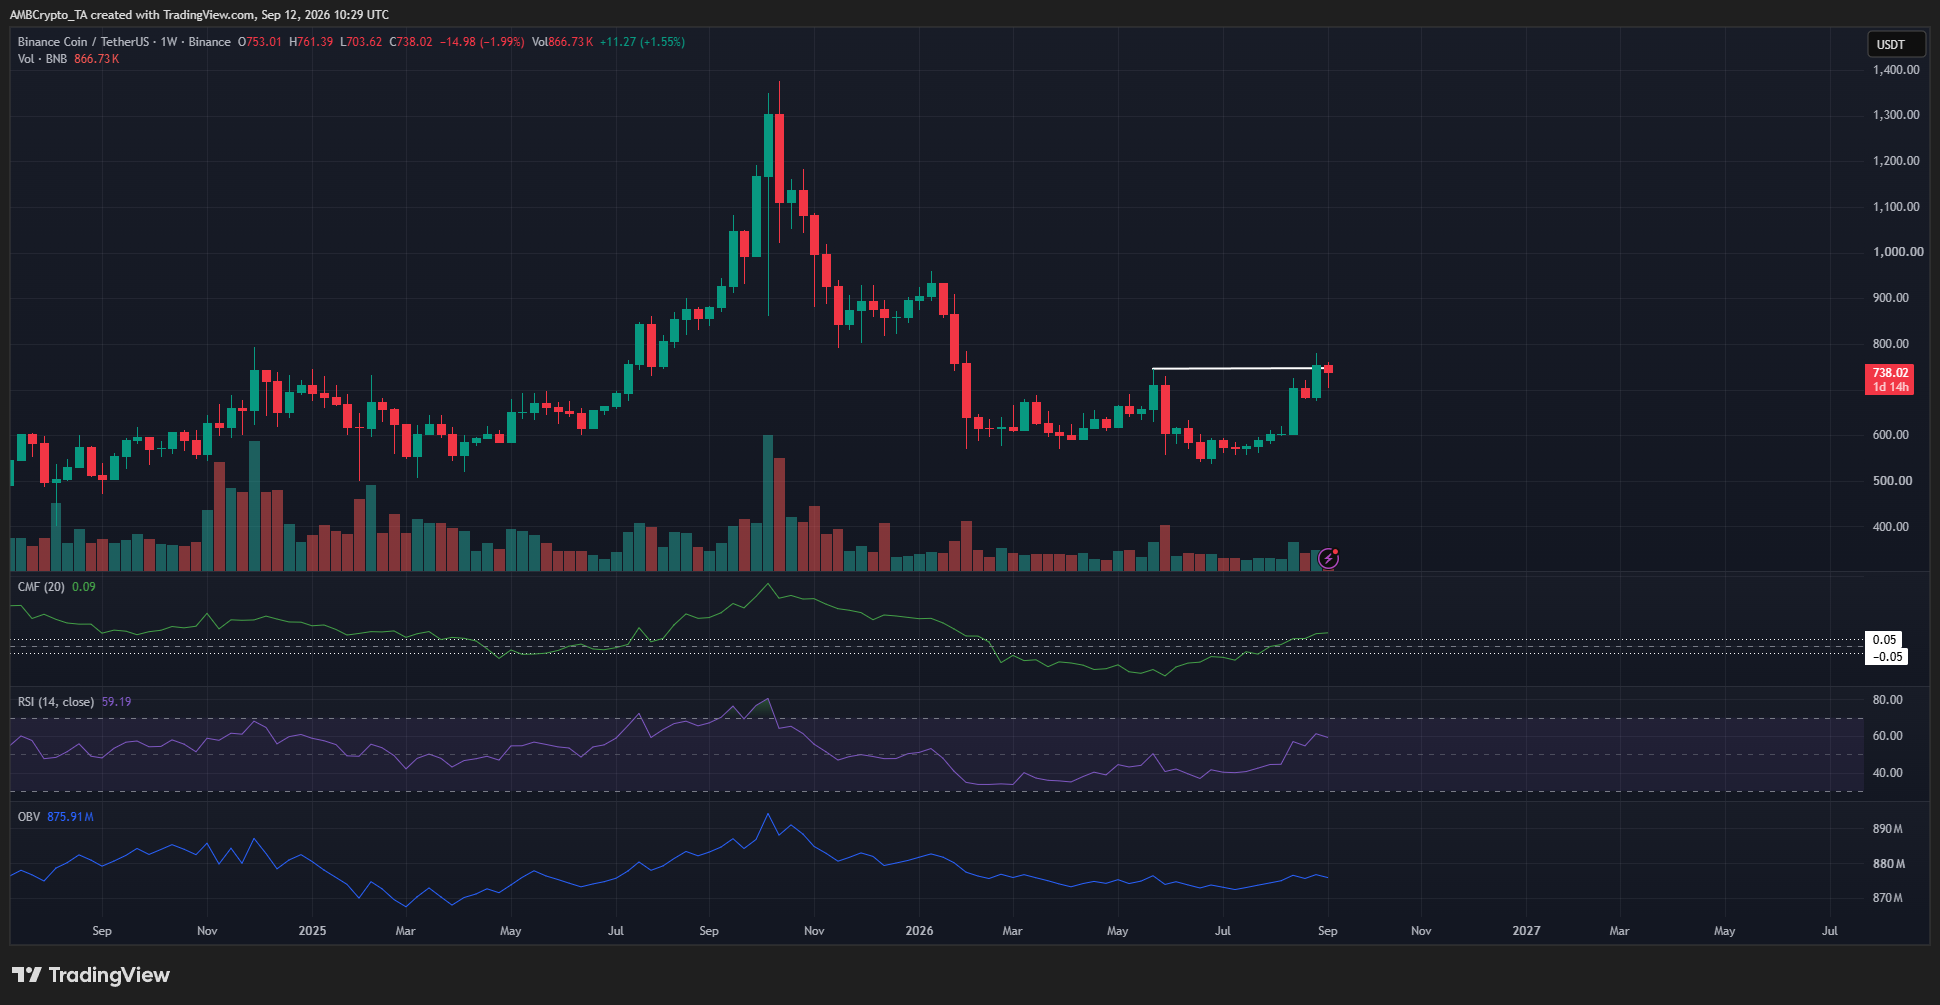
The $745 swing high was one Binance Coin set in late May. It was also the lower high of the altcoin’s bearish trend in 2026. Hence, the breach of this level signaled a longer-term structure shift.
There is reason to be bullish in the long-term. The CMF was back above +0.05, the OBV has begun to climb higher in the past two months, and the RSI was also above neutral 50.
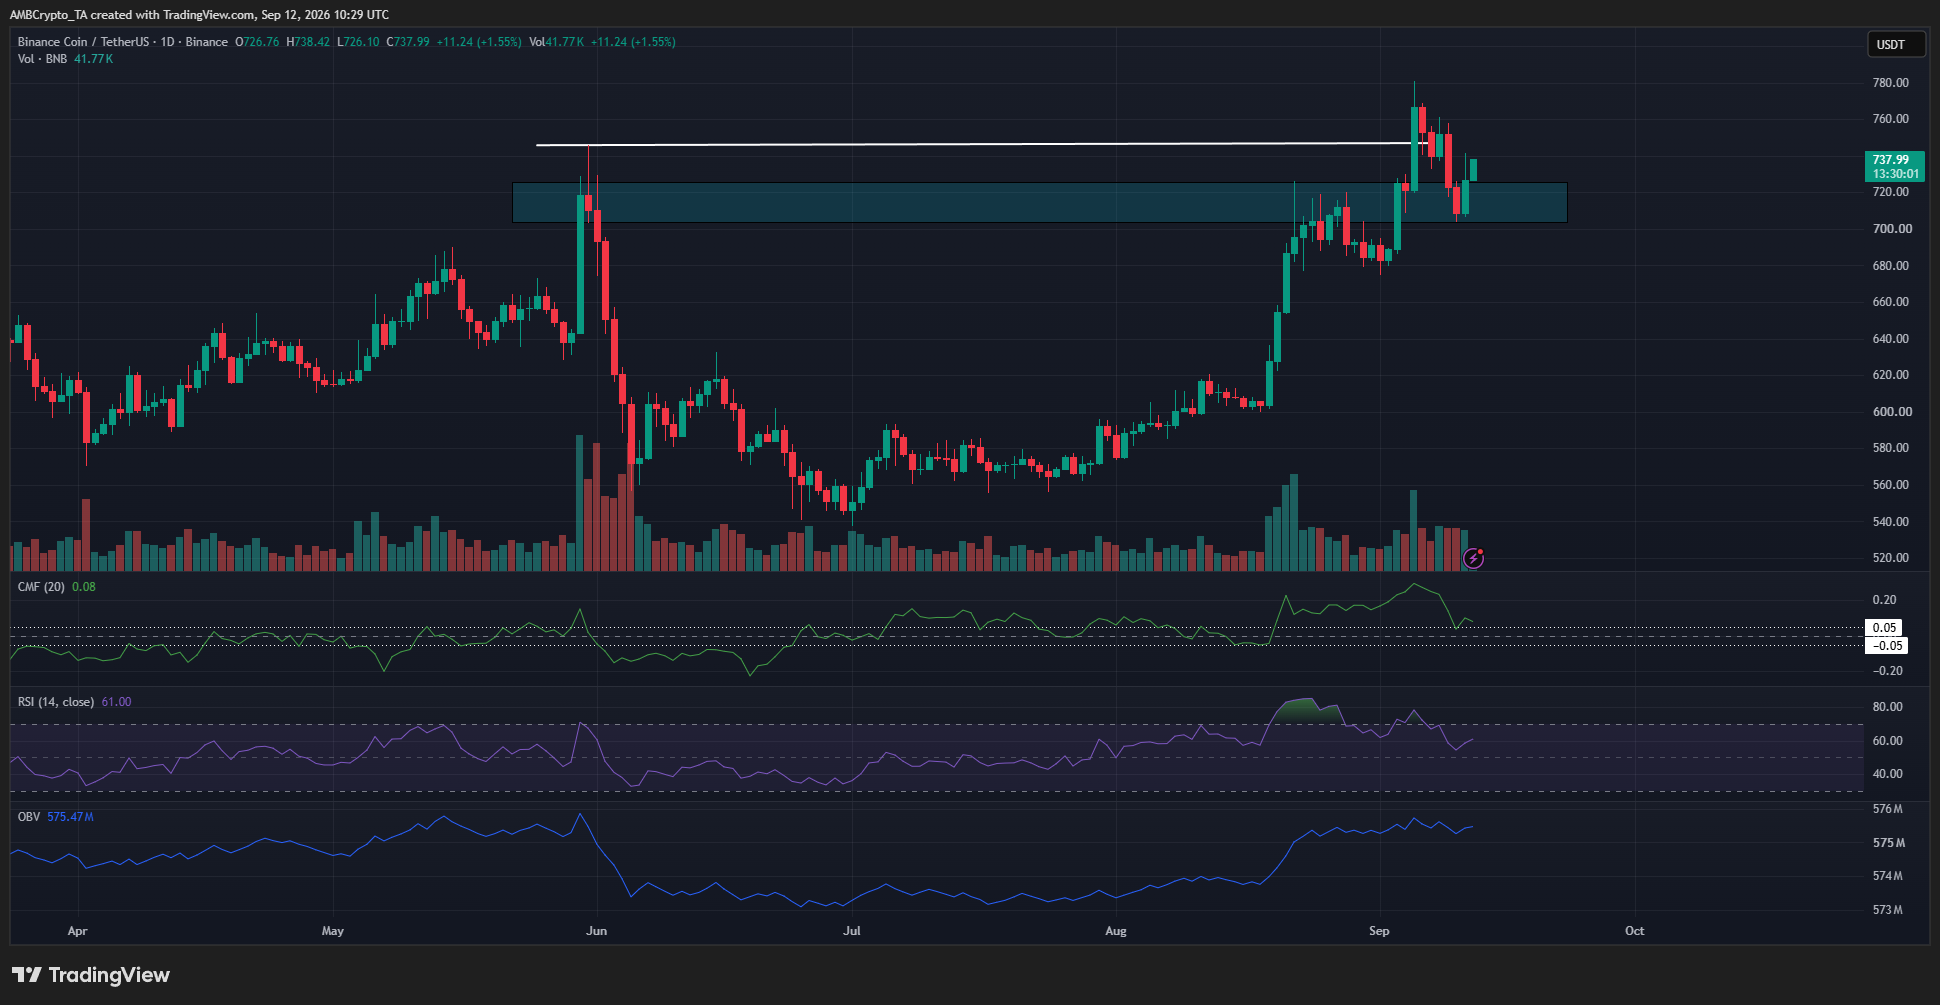
On the daily chart, the technical indicators remained similarly bullish. Additionally, this timeframe highlighted the $700 former supply zone, which had been flipped to support during the early-September rally.
The next higher timeframe price targets, based on the weekly chart, were at $950-$960. The $1,000 is also a key psychological resistance level.
Traders’ call to action- Buy
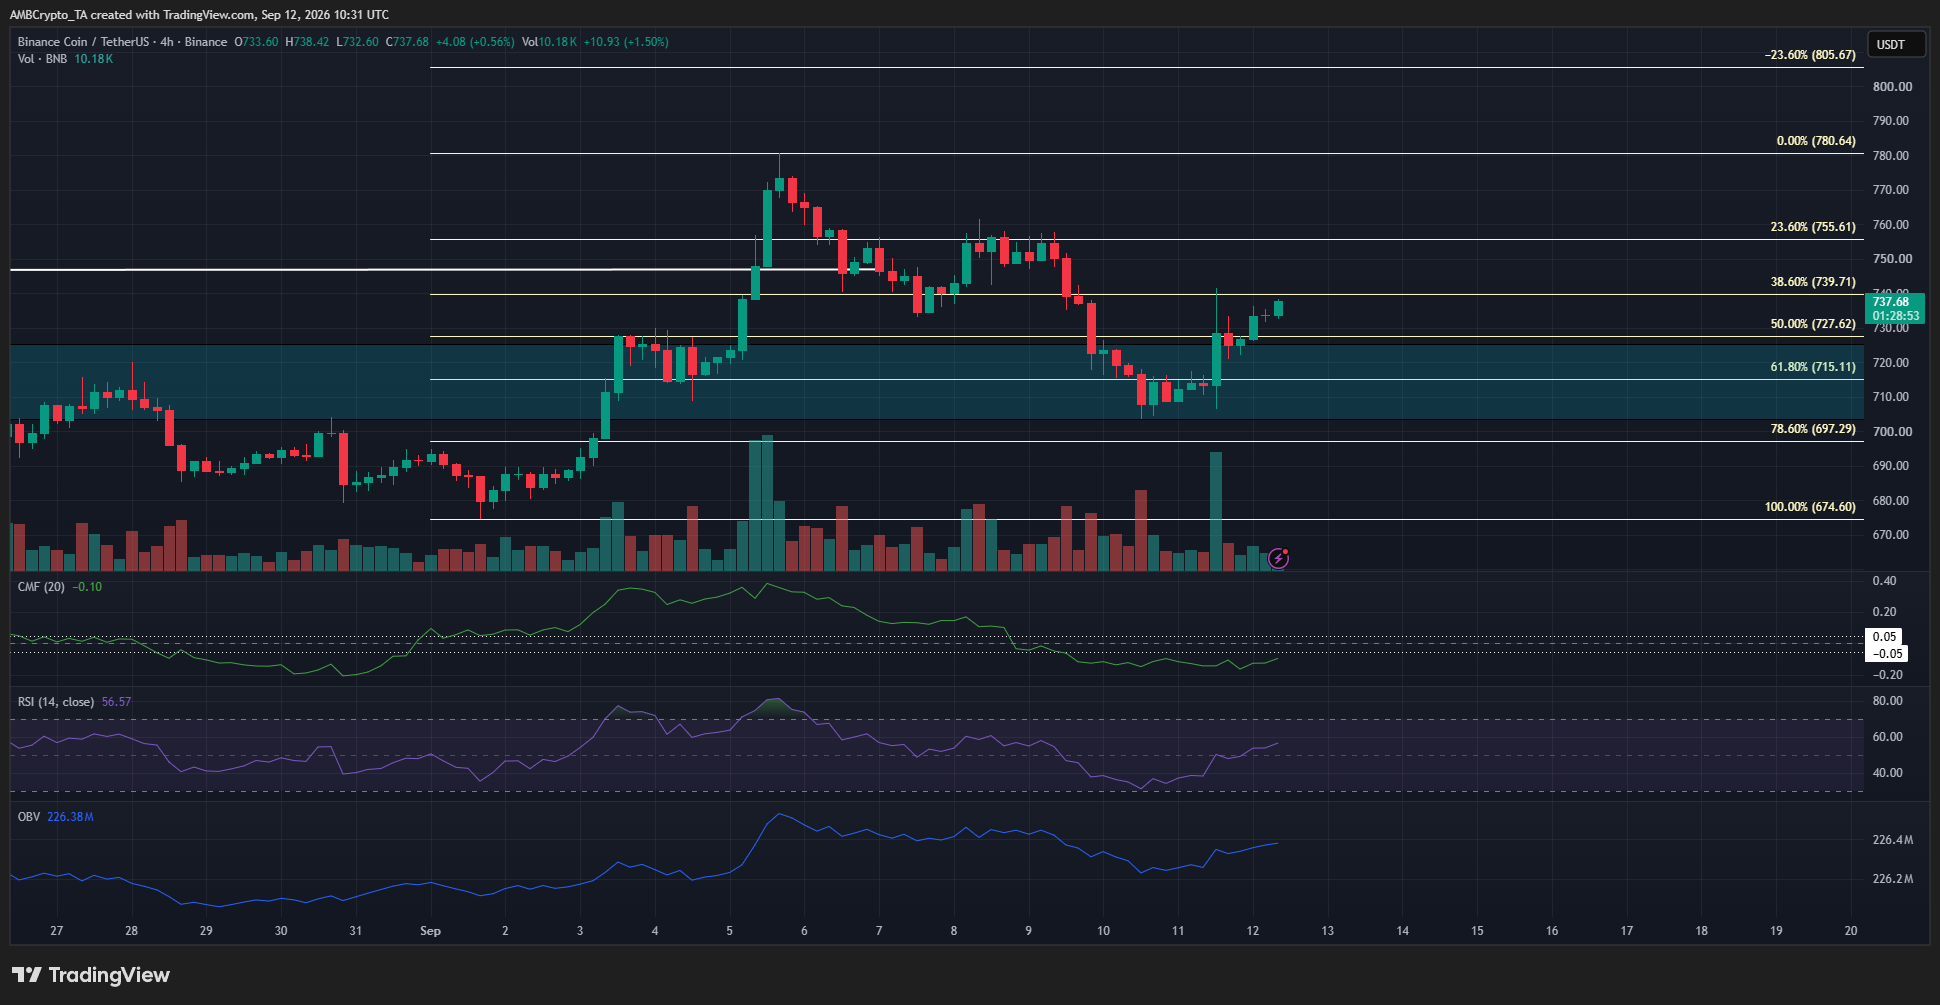
The 4-hour chart also showed a bullish structure. The Fibonacci retracement levels (pale yellow) revealed that the recent BNB retracement had dipped into the golden pocket between $697-$715.
The bullish reaction from this area in recent days was a sign of buyer conviction, though it was not yet reflected on the CMF and OBV indicators.
A breakdown below $697 would be the first sign of trouble for the bulls. A deeper drop below $674 would shift the BNB H4 structure bearishly and invalidate the buy idea.
In this scenario, a deeper retracement to $589-$630 would become likely.
Final Summary
- The Binance Coin long-term trend has shifted bullishly following the break of the $745 resistance.
- Further gains appear likely as BNB responded bullishly after a retest of the $697-$715 golden pocket.