Cardano: The if and how of reclaiming this major level

Disclaimer: The findings of the following analysis are the sole opinions of the writer and should not be considered investment advice
Bitcoin always has a massive impact on the long-term trend of most altcoins. In the case of Cardano, the downtrend of Bitcoin from its highs near $69k has had a brutal effect on Cardano’s own trend. ADA has lost nearly 75% since its ATH, compared to the 40% figure for BTC. The psychological and technical level of support at $1 was lost to selling pressure last month- can the bulls reclaim this level?
ADA- 1D
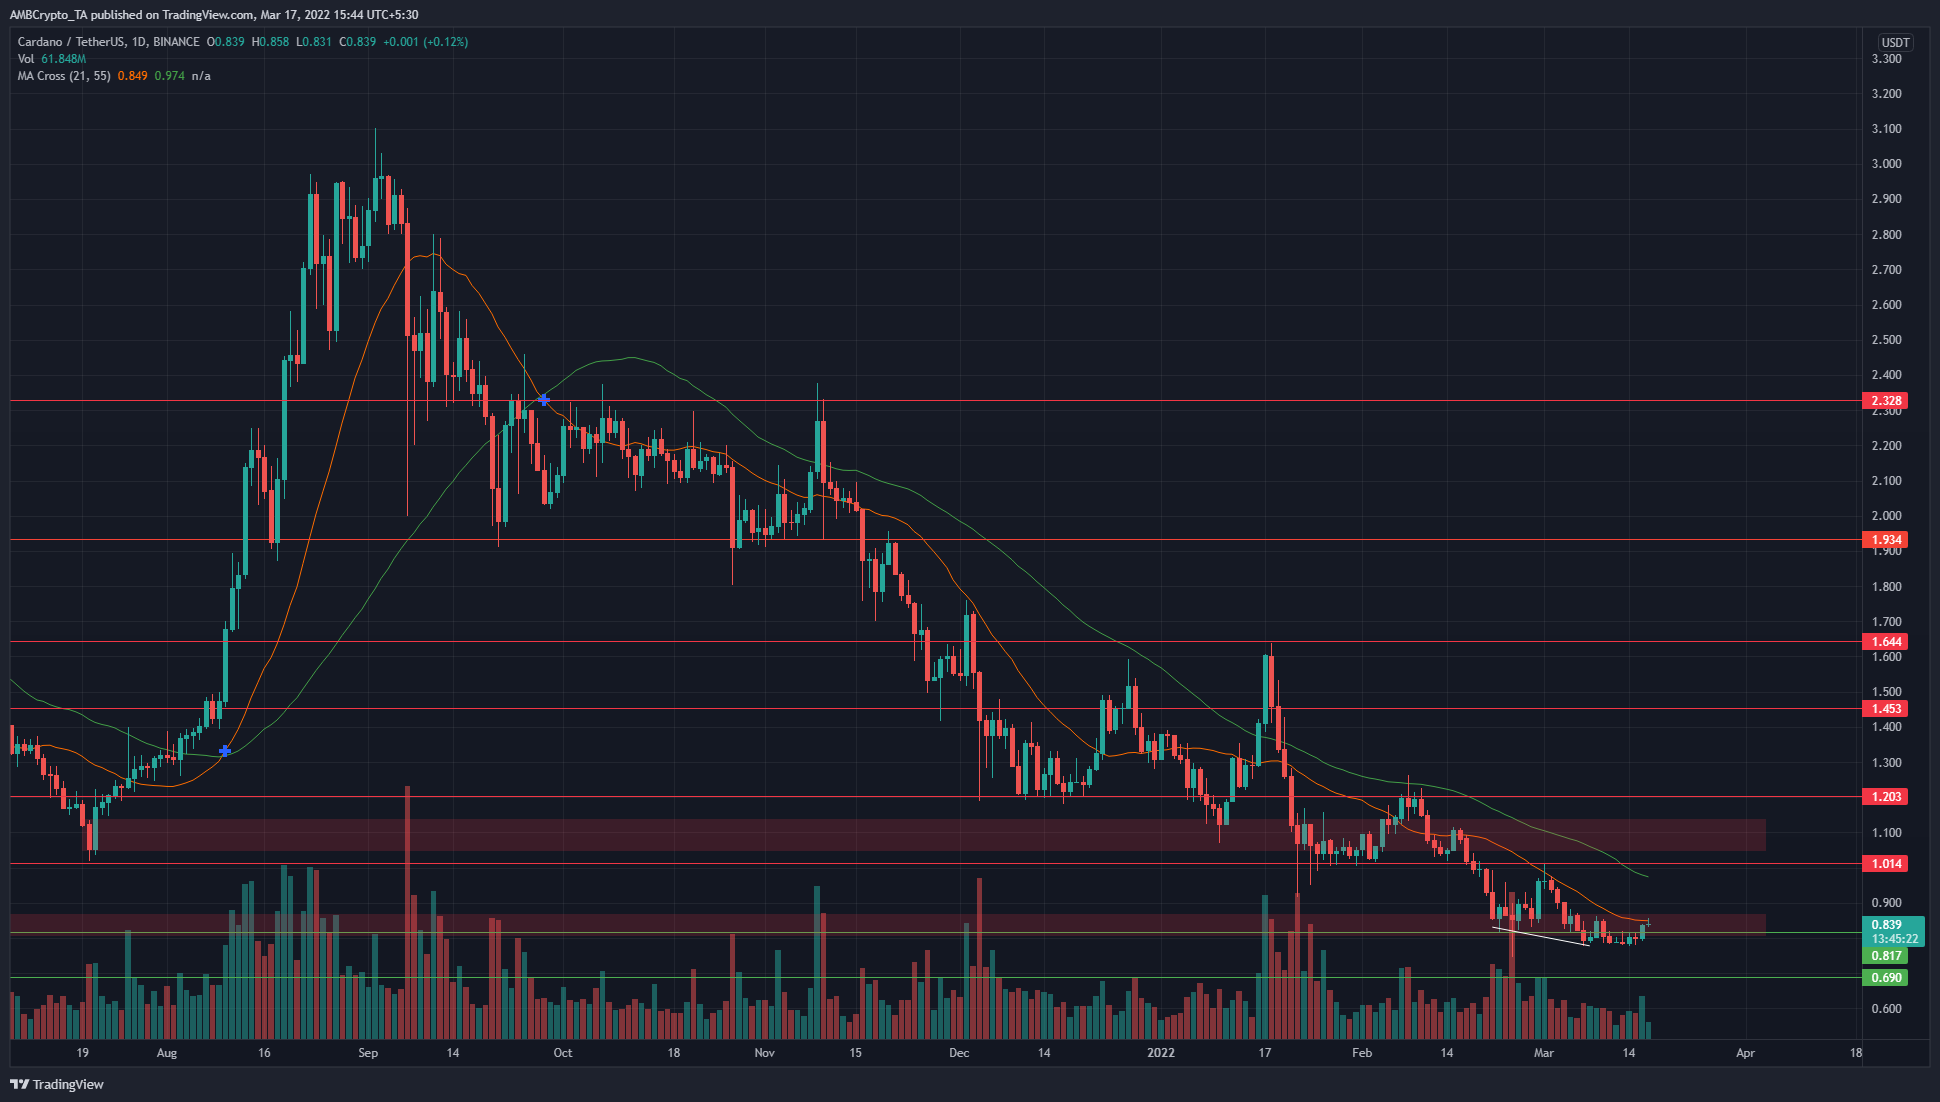
The trend has been persistently bearish once the $2.2 level was broken on a move south back in September last year. Since then, the price has crashed through multiple levels of support, with $1.2 and $1 being some of the most important long-term levels of significance.
At the time of writing, the charts did not look encouraging to the long-term buyers. The price was trading below the $0.85 area at press time. The $1.1 area had seen a bullish order block back in July. In recent months, this area saw some demand arrive, but buyers have been exhausted since.
It was imperative that prices break past the $1 level in order to begin to flip the longer-term bias toward bullish.
Rationale
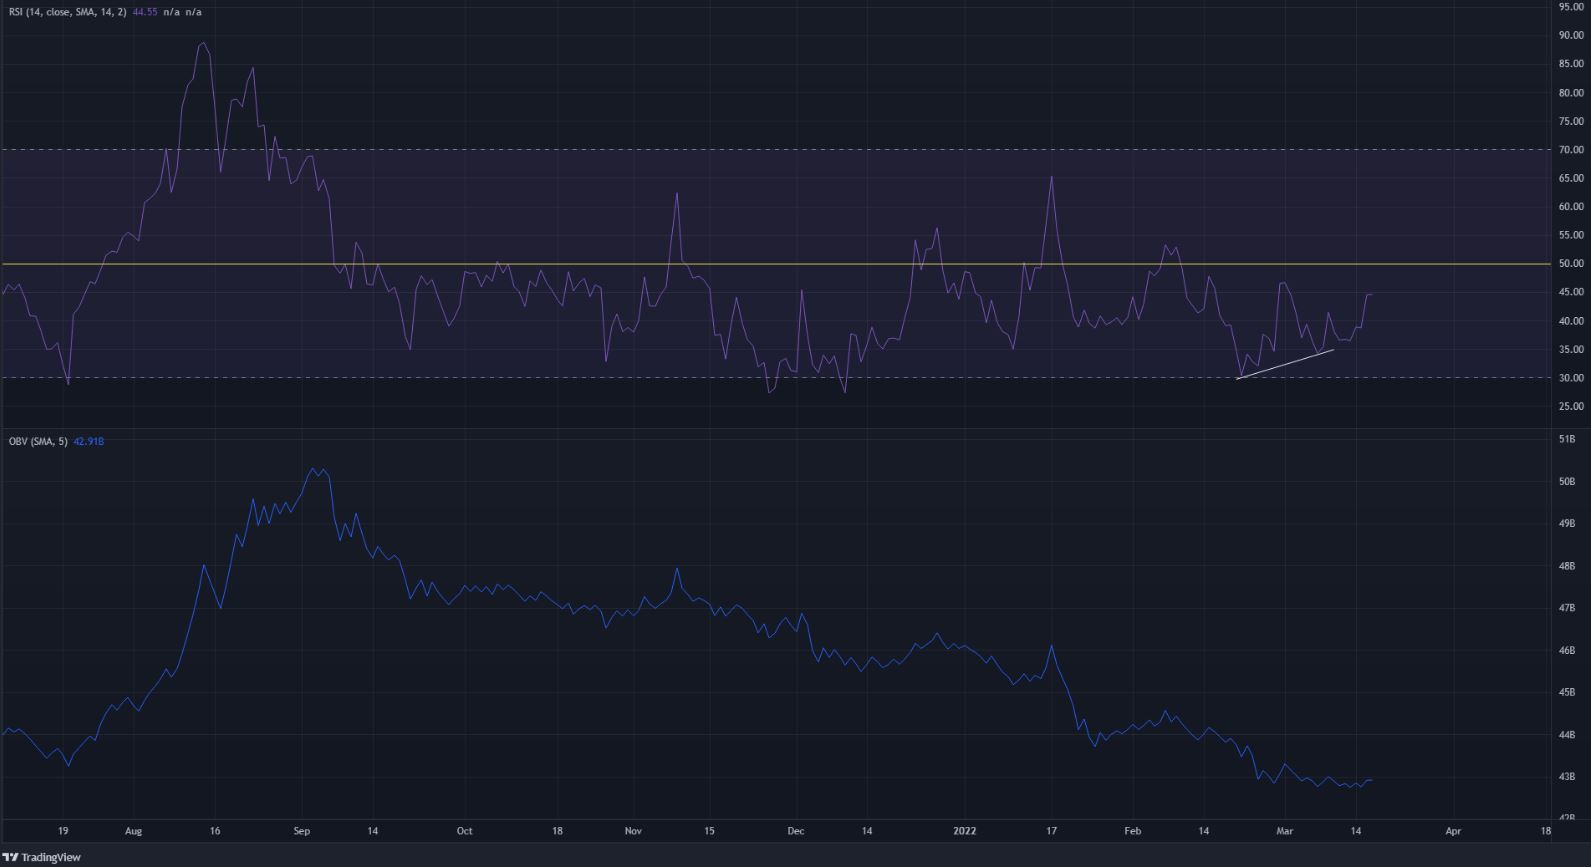
The price on the daily chart was trading beneath the 21 and 55-period simple moving averages (orange and green). This showed a strong downtrend, which the series of lower highs can also attest to. In recent days, the price made a series of lower lows while the RSI made higher lows- a bullish divergence.
This could see a minor bounce toward $0.93-$0.98, which offered some liquidity to the upside for the price to be attracted to. However, such a bounce would only be yet another opportunity to sell ADA.
The OBV has been steadily falling, a sign of steady selling volume and a genuine lack of demand in recent months to overwhelm the sellers.
Conclusion
The price action and the indicators pointed toward further downside for ADA, although a small bounce toward $0.93 could be seen in the next few days. Unless ADA can rise past $1 and test $1.2, risk-averse investors can opt to wait for a buying opportunity to present itself.