ChainLink
Can Chainlink [LINK] break out in the next 30 days?
LINK’s potential for a breakout in the short term is alarmingly low.
![Can Chainlink [LINK] break out in the next 30 days?](https://ambcrypto.com/wp-content/uploads/2024/06/link-jai-1000x600.jpg)
- LINK plummeted, with repeated “death crosses” and multiple double-bottom patterns.
- The altcoin’s RSI and Ichimoku Cloud confirmed that bears dominated at press time.
In the past two weeks, Chainlink [LINK] has experienced a 25% decrease, raising questions about its short-term and long-term prospects.
This sharp decline concerned investors, prompting AMBCrypto to look closely into LINK’s potential for a breakout in the next 30 days.
Odds of a rally are low
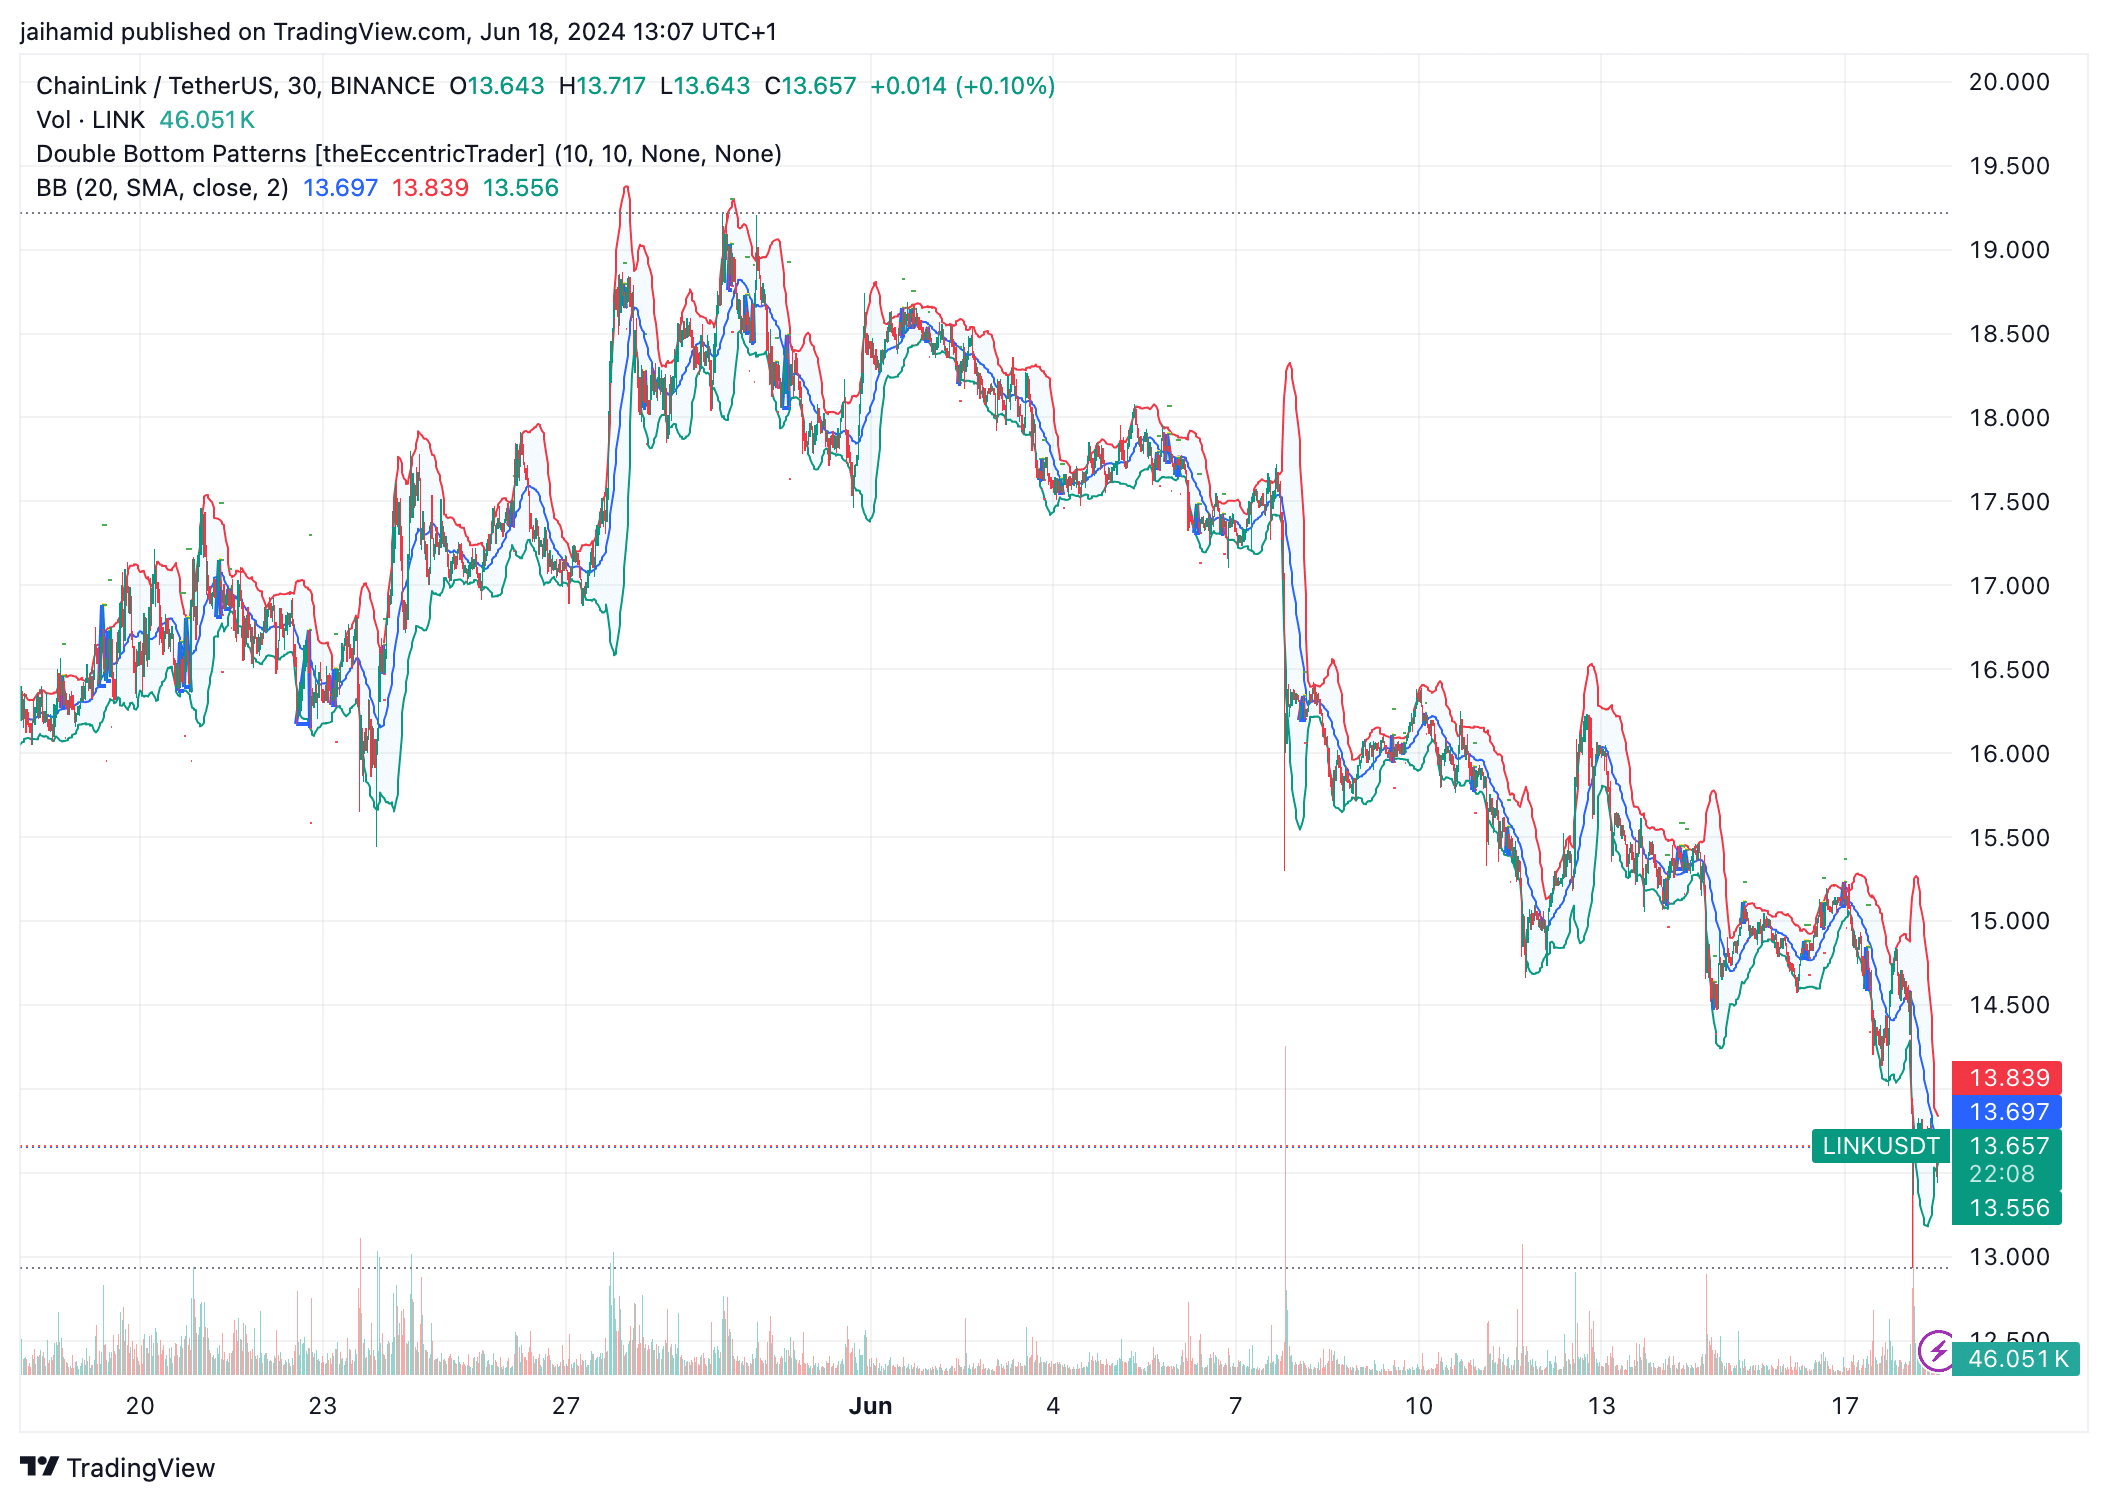
We examined LINK’s trading chart for the past month to see the prominent bullish indicator known as the double-bottom pattern.
As seen on the chart below, LINK has seen multiple double-bottoms, showing three instances of bullish reversal.
The price frequently staying near or below the lower Bollinger Band means there is a lot of bearish pressure, but it also points to potential oversold conditions that could tempt buyers back into the market.
The 50-day MA has crossed below the 200-day MA, the infamous “death cross” signal that typically indicates a bearish market outlook and potentially more declines.
The RSI values have remained mostly below the 60 level, often hovering near or below the midline (50), suggesting that bears are in control.
The lack of any sustained movement above 60 reinforces the absence of bullish momentum in the short term.
LINK is stuck with the bears
The price has tested and slightly breached the previous support level of around $13.50, but it could not hold due to the continuous bearish pressure.
Source: TradingView
The price action is consistently below the Ichimoku Cloud, signaling a strong bearish trend.
This means that LINK has absolutely no immediate signs of recovery, reinforced by the MACD line (blue) being below the signal line (orange) and close to the zero line.
Only 37% of LINK holders are in profit at the current price, and the majority (54%) are out of the money. This has contributed to selling pressure as investors try to minimize losses.
Source: IntoTheBlock
AMBCrypto’s analysis of IntoTheBlock
showed that exchange inflows are lower than outflows ($35.48 million vs. $36.54 million).Realistic or not, here’s LINK market cap in BTC’s terms
So. more LINK was being moved off exchanges, potentially for holding in private wallets. This is a sign of accumulation, and wherever there is accumulation, there are bulls.
While LINK is unlikely to break out in the next 30 days, it still has strong long-term potential.


