ChainLink
Can Chainlink surge 42% to $22 after the recent breakout?
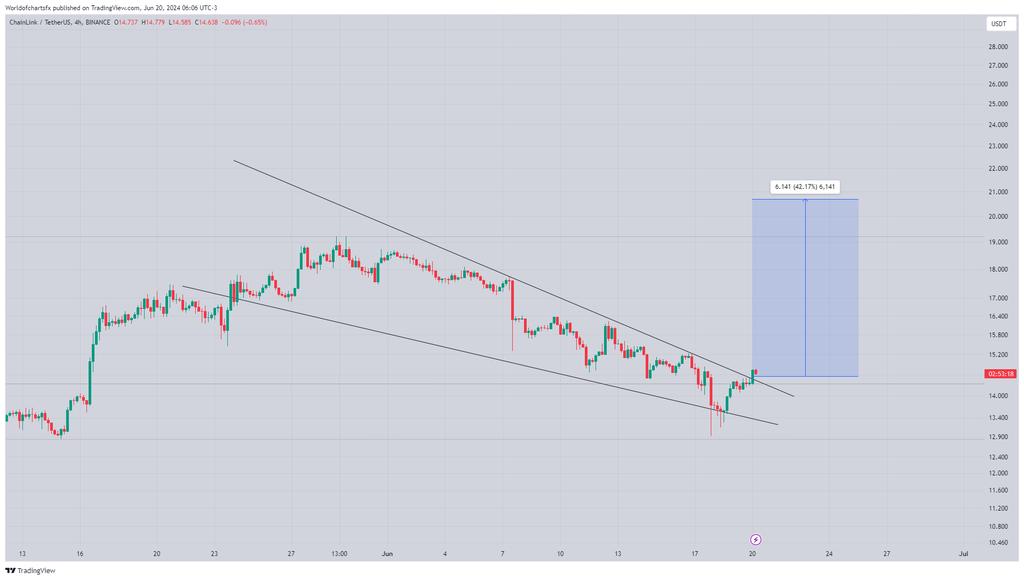
Chainlink has finally broken above a bullish falling wedge pattern that could push LINK to $22 soon.

- LINK’s price declined by more than 7% in the last week.
- Market indicators hinted at a few slow-moving days.
After days of continued setbacks, Chainlink [LINK] finally showed signs of recovery. This was the case as the token managed to break out of a bullish pattern that could result in LINK touching new highs over the coming weeks or months.
Chainlink’s bullish breakout
CoinMarketCap’s data revealed that its price had declined by more than 7% in the last week. In the last 24 hours, the token also witnessed a 1.3% price decline.
At the time of writing, LINK was trading at $14.27 with a market capitalization of over $8.37 billion.
The price decline pushed several investors into losses. As per IntoTheBlock’s data, only 46% of Chainlink investors were in profit. However, there were chances of a trend reversal.
AMBCrypto reported earlier that LINK had been consolidating inside a bullish wedge pattern since April. The better news was that the token finally managed to break out of the pattern.
World Of Charts, a popular crypto analyst, recently posted a tweet highlighting this breakout. If LINK tests this pattern, then investors might soon witness LINK surge 42%, allowing it to touch $22 in the coming weeks.
Will LINK reach $22?
Since the bullish breakout gave hope for a price increase, AMBCrypto planned to analyze its on-chain data.
Our analysis of Santiment’s data revealed that LINK’s MVRV ratio improved after plummeting on the 18th of June.
Similarly, after a dip, LINK’s weighted sentiment also improved, meaning that bearish sentiment around the token declined. Its network growth has increased in the recent past.
This meant that more addresses were created to transfer the token.
Nonetheless, investors were still considering selling Chainlink. This seemed to be the case, as there was a slight rise in LINK’s supply on exchanges.
Since selling pressure increased, AMBCryopto then analyzed Chainlink’s daily chart to better understand what to expect from the token in the coming days.
As per our analysis, there were chances of a price uptick as LINK’s price had touched the lower limit of the Bollinger Bands.
However, the rest of the indicators hinted at a few slow-moving days. For instance, both LINK’s Relative Strength Index (RSI) and Chaikin Money Flow (CMF) went sideways under their respective neutral marks.
Realistic or not, here’s LINK market cap in BTC’s terms
If LINK turns bullish, then it might have to go above a few critical zones before eyeing $22. Hyblock Capital’s data revealed that LINK’s liquidation would rise sharply, near $14.8.
Generally, high liquidation results in short-term price corrections. LINK will face another resistance near $15 and a breakout above that would open doors for LINK to climb to $22.


