



The edge for a staking protocol is the yield it offers, which incentivizes long-term holding.
Simply put, unlike pure speculative assets, which rely on price appreciation for returns, staking assets generate yield, providing investors with an incentive to hold through market cycles.
The question is whether this structural divergence can keep Ethereum outperforming Bitcoin after delivering nearly 2x BTC’s ROI so far in Q3. Technically, though, Ethereum’s biggest test might just be getting started.
Can ETH break its bearish pattern?
Since topping in August 2025, ETH has repeatedly formed a local top within two to three days whenever the daily RSI has moved above 65. As of press time, RSI was back above that level.
If ETH tops out once more, it would suggest the bearish structure remains intact. However, if it doesn’t and the price continues to consolidate, it would mark the first break in this pattern, potentially signaling Ethereum’s first bullish shift since April 2025.
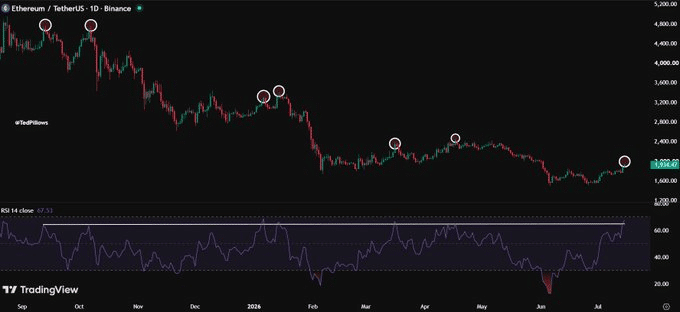
To understand whether Ethereum [ETH] can break this trend, it’s worth looking at what sparked the rally.
So far, much of the market has pointed to the CPI report, which reignited risk appetite and fueled a sharp risk-on rally. Notably, ETH’s on-chain metrics and technical setup have reinforced this move.
Since the CPI release, ETH has rallied 10%+, making it the best-performing asset among the top 10 over the past week.
And it doesn’t stop here. The rally gained more momentum once key resistance gave way.
According to CryptoQuant, nearly $30 million in ETH future positions were liquidated on Binance within a single hour as ETH broke above $1,900. In essence, the softer CPI acted as the key catalyst that pushed Ethereum through resistance, driving a nearly 5% rally in the ETH/BTC pair.
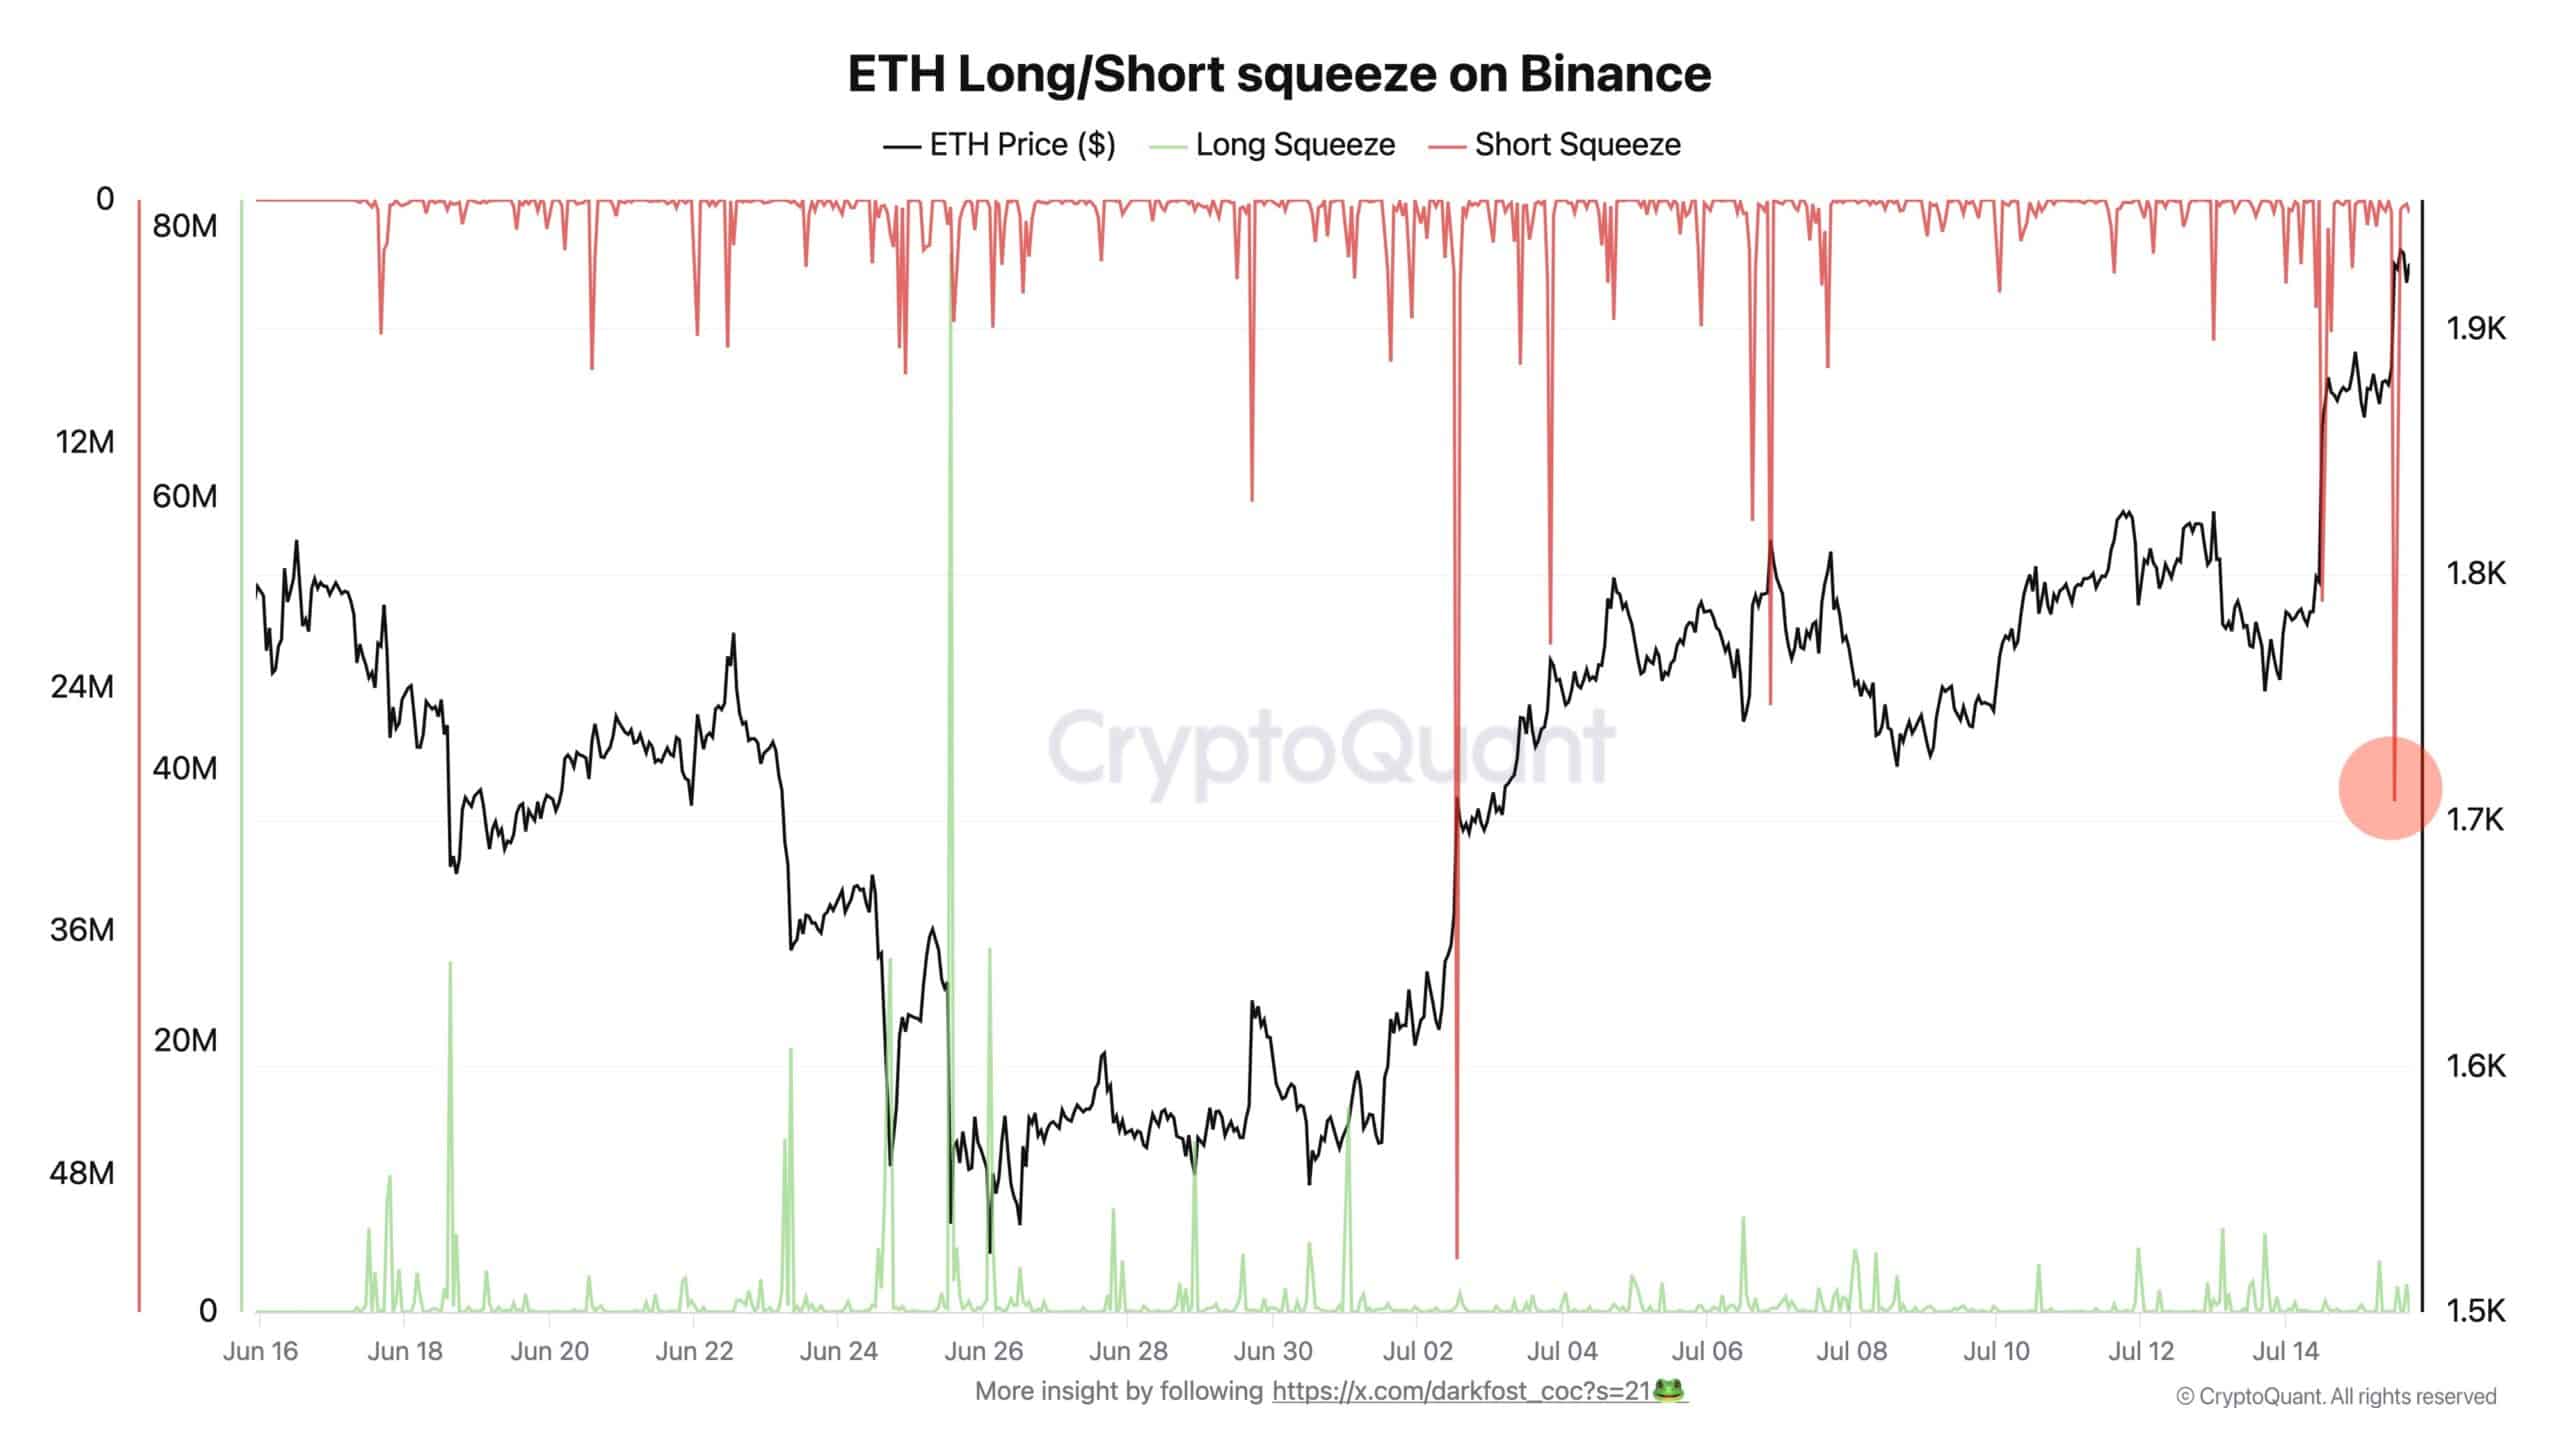
However, the rally is now approaching a key test.
With the RSI back above 65, the risk of profit-taking is rising, while BTC.D continues to consolidate around 58%. The question is whether Ethereum could sustain its momentum this time.
Notably, this is where the “yield” narrative could start to make a difference.
Ethereum’s next move depends on one key divergence
Looking at the setup above, short-term capital rotation appears to be driving Ethereum’s rally.
That said, institutional positioning tells a different story. According to SoSoValue, spot ETH ETFs have attracted more than $200 million in net inflow so far this month, while spot Bitcoin ETFs have recorded a net outflow of $11.27 million.
Technically, that’s a flow divergence of more than $211 million in Ethereum’s favor.
Notably, the same trend is playing on-chain.
As the chart shows, 2.6 million ETH has been queued for staking over the next 45 days. Against an existing staking base of 40 million, that’s an additional 6.5% jump in locked supply. If this pace continues, total staked ETH would climb to 42.6 million in the near-term.
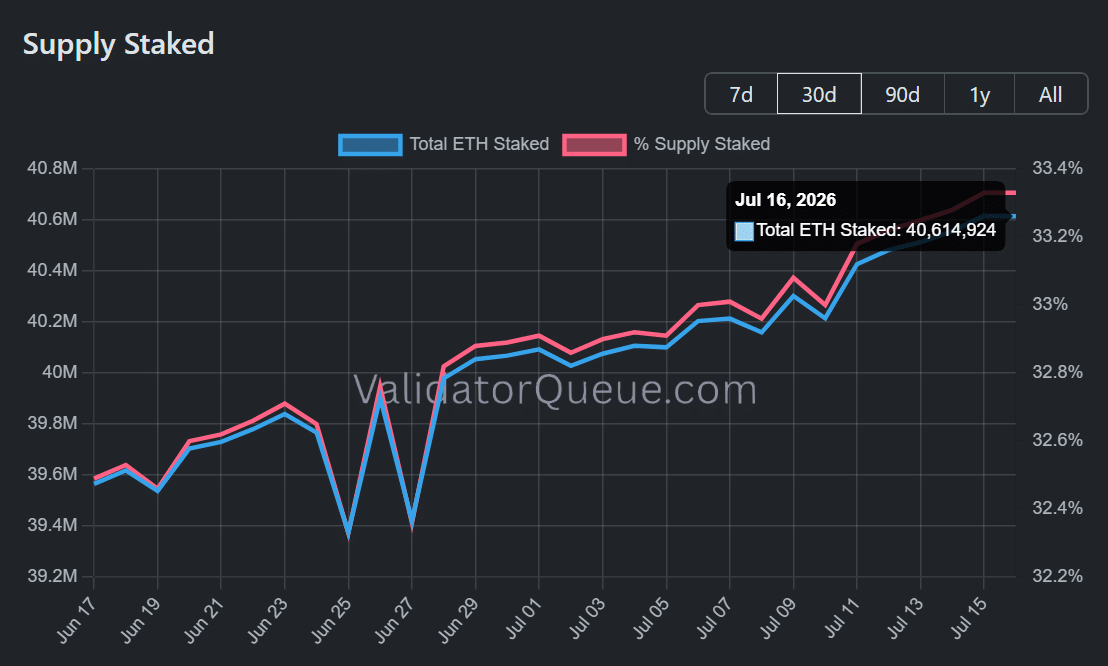
More importantly, this demand is building even as Ethereum’s staking APR has dropped back to 2.6%, its lowest level since early Q1.
In other words, investors are continuing to lock up ETH despite lower yields. It is a sign that long-term conviction, rather than yield alone, is driving staking demand.
Notably, this is where BitMine’s recent report starts to stand out.
The company generated $45.7 million in ETH staking revenue for the three months ended May 31, 2026, while staking approximately 4.9 million ETH.
Simply put, even with staking yields at just 2.6%, Ethereum continues to generate recurring income, reinforcing its long-term investment case.
In this context, the potential 6.5% increase in locked ETH supply becomes even more important. It shows that Ethereum’s strength vs. Bitcoin isn’t just a short-term trade.
Instead, it could be the early sign of ETH breaking away from its RSI topping pattern and entering a new phase of relative strength.
Final Summary
- Ethereum’s rally faces a key test as RSI reaches high levels.
- Rising ETH staking demand suggests Ethereum’s strength against Bitcoin could continue beyond a short-term rally.