Can Ethereum bulls defend the last support and mount a rally to $3,500

Ethereum price has shattered one-half of a significant support confluence, suggesting that the bears are taking control. However, the said foothold still holds true and hence, the chances of reversal are not extinguished completely.
Ethereum price to restart its upswing
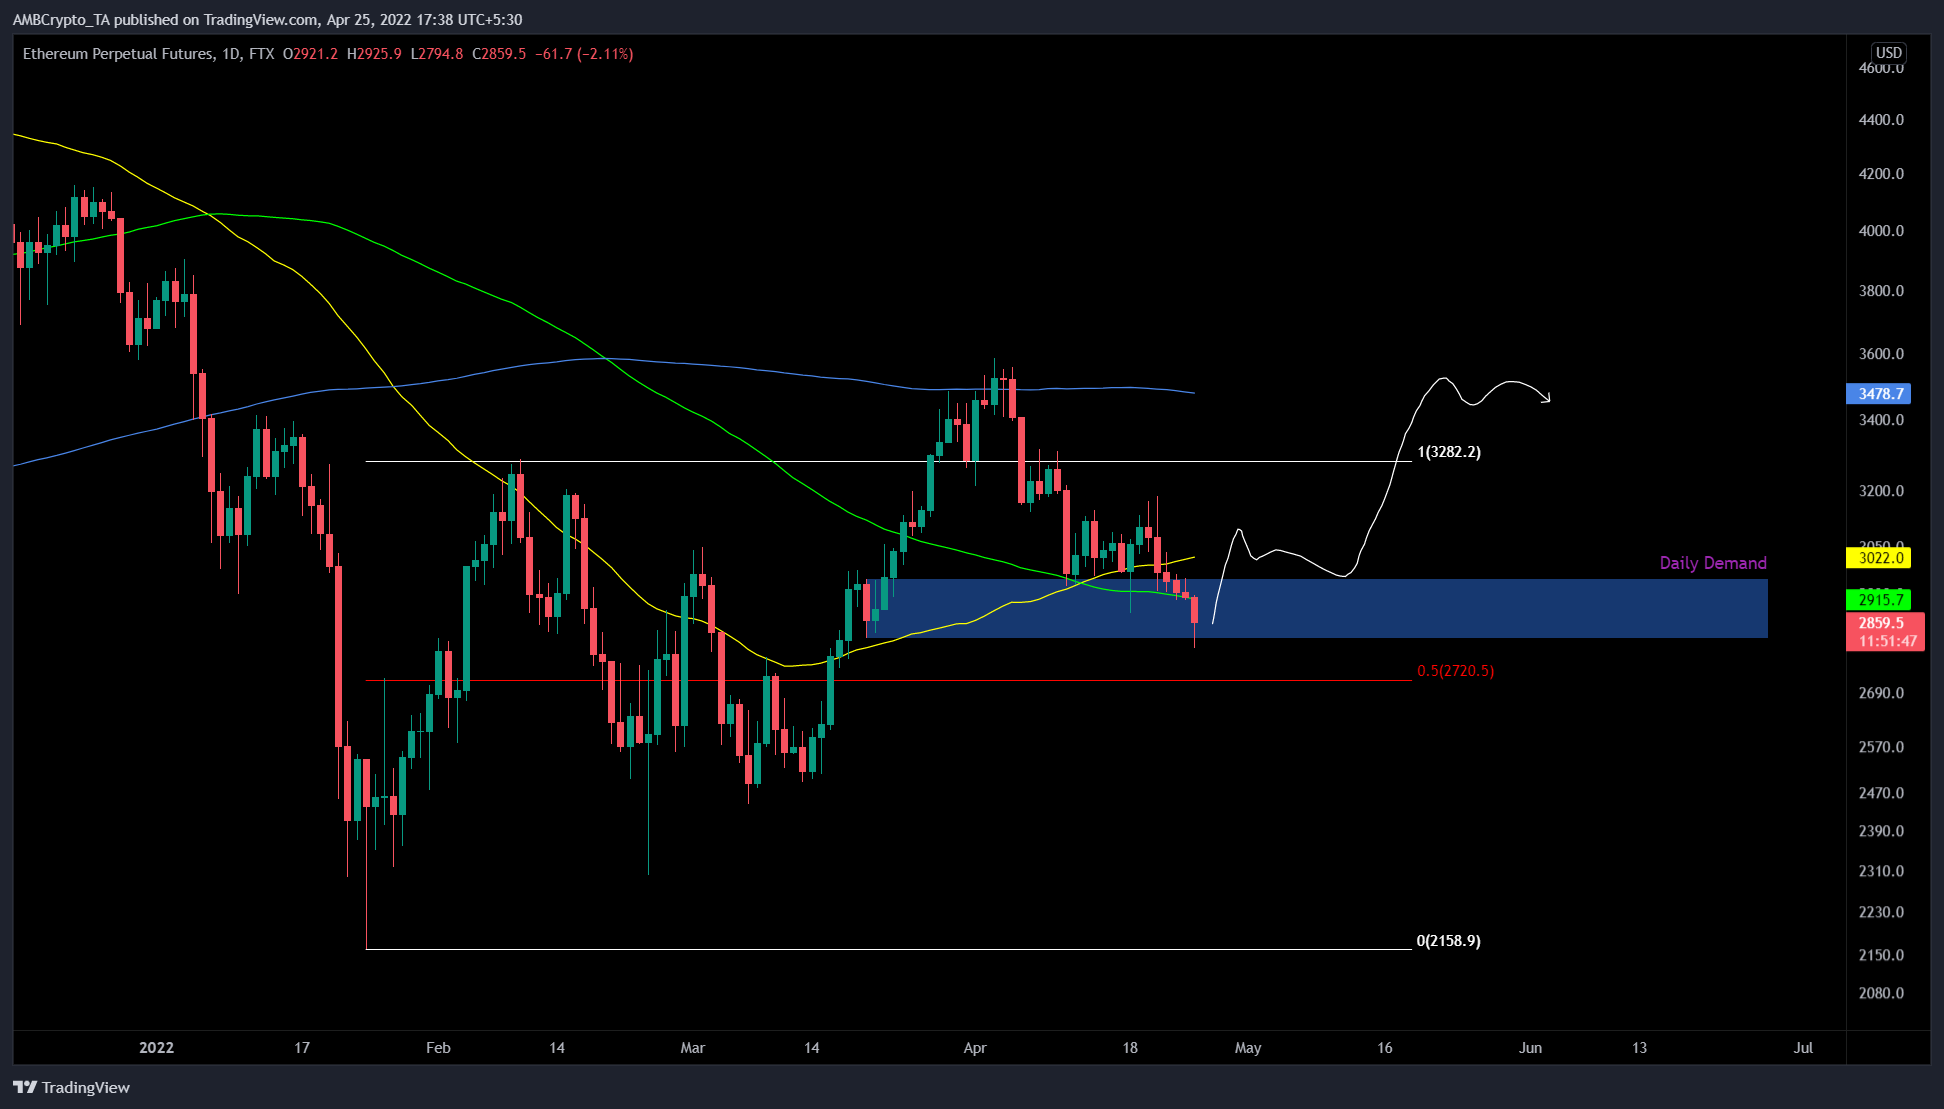
Ethereum’s price is set a range extending from $2,158 to $3,282 after rallying 52% between 24 January and 10 February. These barriers served as a boundary that the bulls and bears still respect.
The range-bound price action often sees a breach of one of the limits followed by a run toward the opposite limit. For Ethereum price, the range high was swept on 28 March after a 43% upswing from $2,498 to $3,583.
This uptrend was followed by a reversal due to profit-taking, which led to a 22% downswing to where ETH currently trades – $2,856. This correction has pierced the 50-day Simple Moving average (SMA) and the 100-day SMA and the daily demand zone, extending from $2,820 to $2,966. However, buyers seem to be responding, which has led to a small recovery inside the demand zone, suggesting that this level is not invalidated yet.
Therefore, investors can expect ETH to still trigger an uptrend. If this rally shatters through the 100-day SMA at $3,022, there is a good chance it can make its way to the range high at $3,282. In some cases, Ethereum price might extend to the 200-day SMA at $3,478 where it was rejected the last time around.
This run-up, in total, would amount to 21% gain and is likely where a temporary top will be formed for ETH.
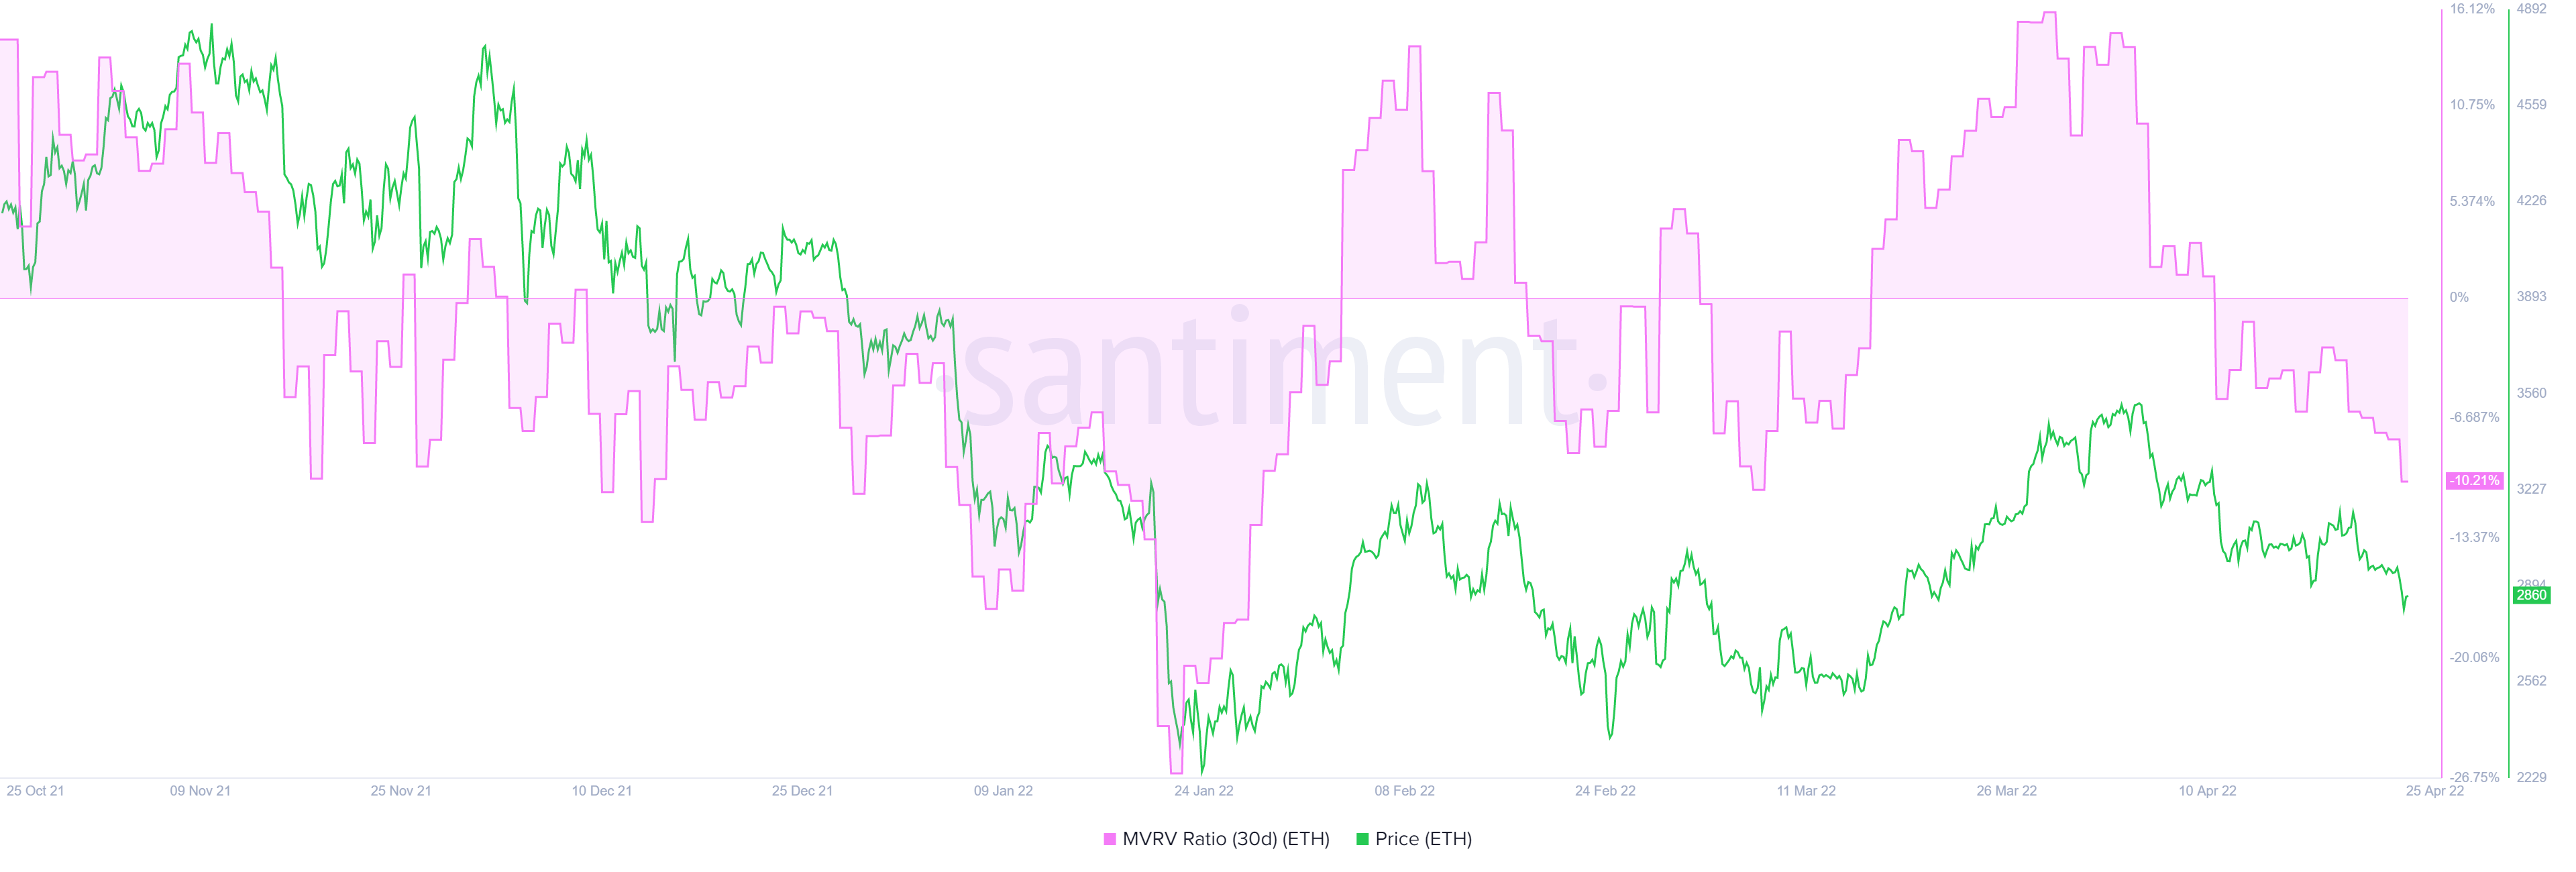
Supporting this bullish outlook for Ethereum price is the 30-day Market Value to Realized Value (MVRV) model. As mentioned in previous articles, this indicator is used to assess the average profit/loss of investors that purchased ETH tokens over the past month.
Based on Santiment’s backtests, a value below -10% to -15% indicates that short-term holders are at a loss and is typically where long-term holders accumulate. Therefore, a value below -10% to -15% is often referred to as an “opportunity zone,” since the risk of a sell-off is less.
For Ethereum, the 30-day MVRV is hovering around -10.2%, which is where ETH formed a local bottom on February 24 and March 7. Both these times, Ethereum price rallied around 30% in under two weeks.
Therefore, if history repeats, there is a good chance, that the recent downtrend is a “buy-the-dip” move.