
- Ethereum’s MACD indicator on the one-day chart showed a bullish divergence.
- Ethereum exchange outflows and open interest have spiked, hinting toward bullish sentiment.
The crypto fear and greed index spiked to 73 after Bitcoin [BTC] broke above $67,000. Despite this bullish bias, Ethereum [ETH] is yet to post significant gains.
The largest altcoin traded at $2,604 at press time after a slight 0.4% dip in 24 hours.
Ethereum is showing a bullish divergence on the daily chart. The Moving Average Convergence Divergence has flipped positive.
Additionally, the MACD histogram bars have turned green and increased in size, showing that bullish sentiment is gaining strength.
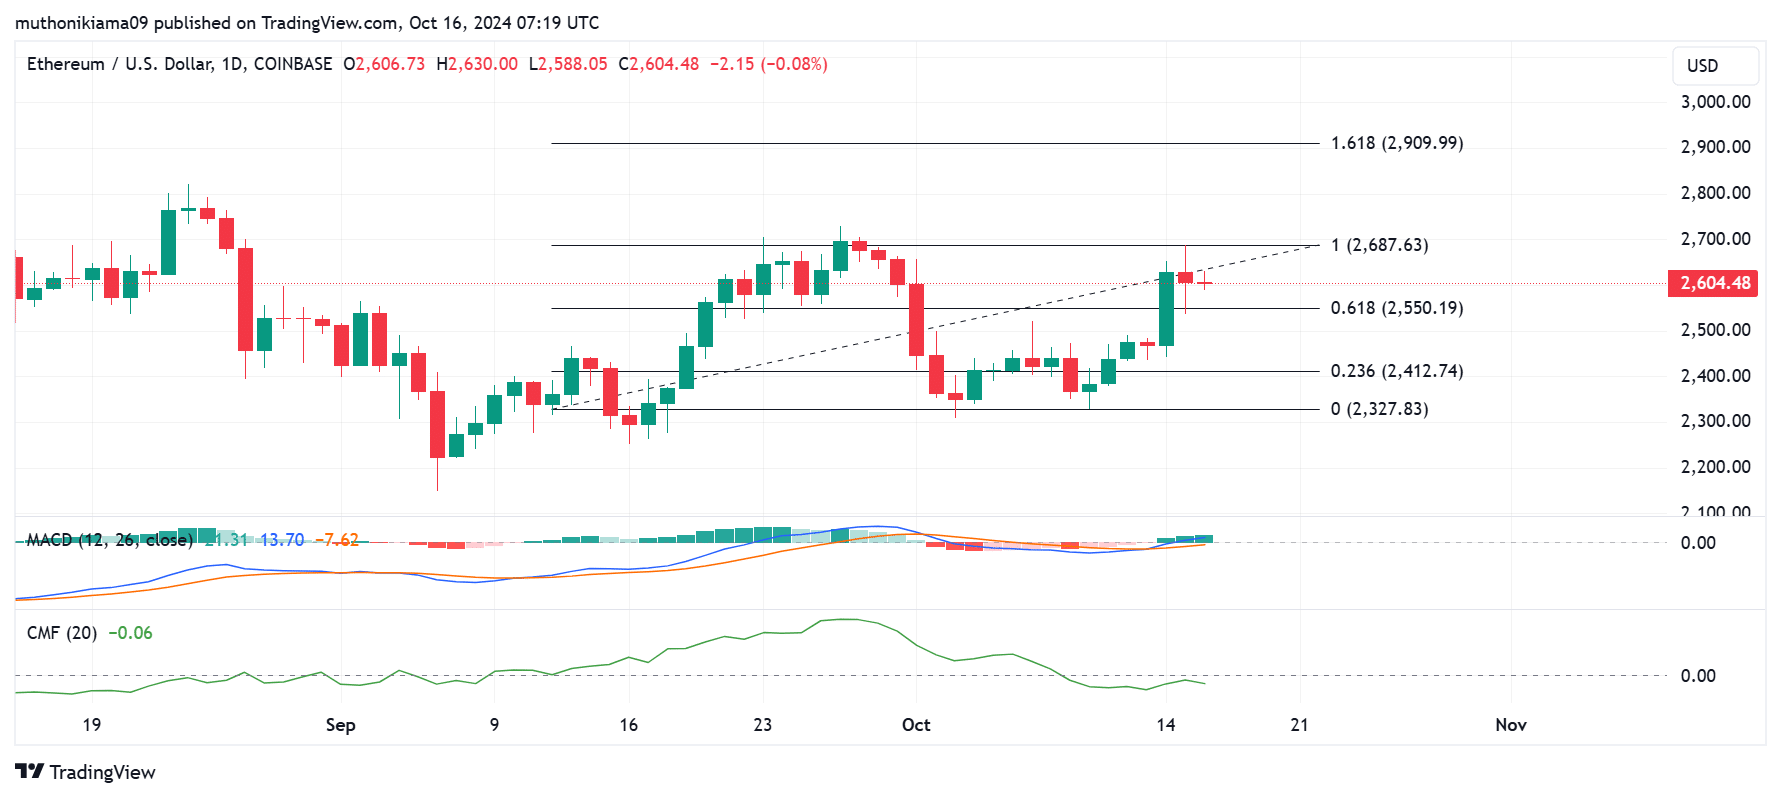
Source: TradingView
However, the Chaikin Money Flow (CMF) had a negative value, indicating that more capital was flowing from ETH than into the altcoin.
This showed that buyers were still not convinced, and could be waiting for ETH to break a crucial resistance level at $2,687 before entering the market.
If the bullish divergence portrayed by the MACD plays out, ETH will push past this resistance level and set the next target at $2,900. A look at on-chain metrics shows that this rally is likely.
Ethereum exchange outflows hit two-week high
Ethereum outflows from exchanges jumped to a two-week high on the 15th of October as traders withdrew their tokens from exchanges, showing a lack of intent to sell.
During the day, ETH outflows reached 589,611, valued at more than $1.5 billion.
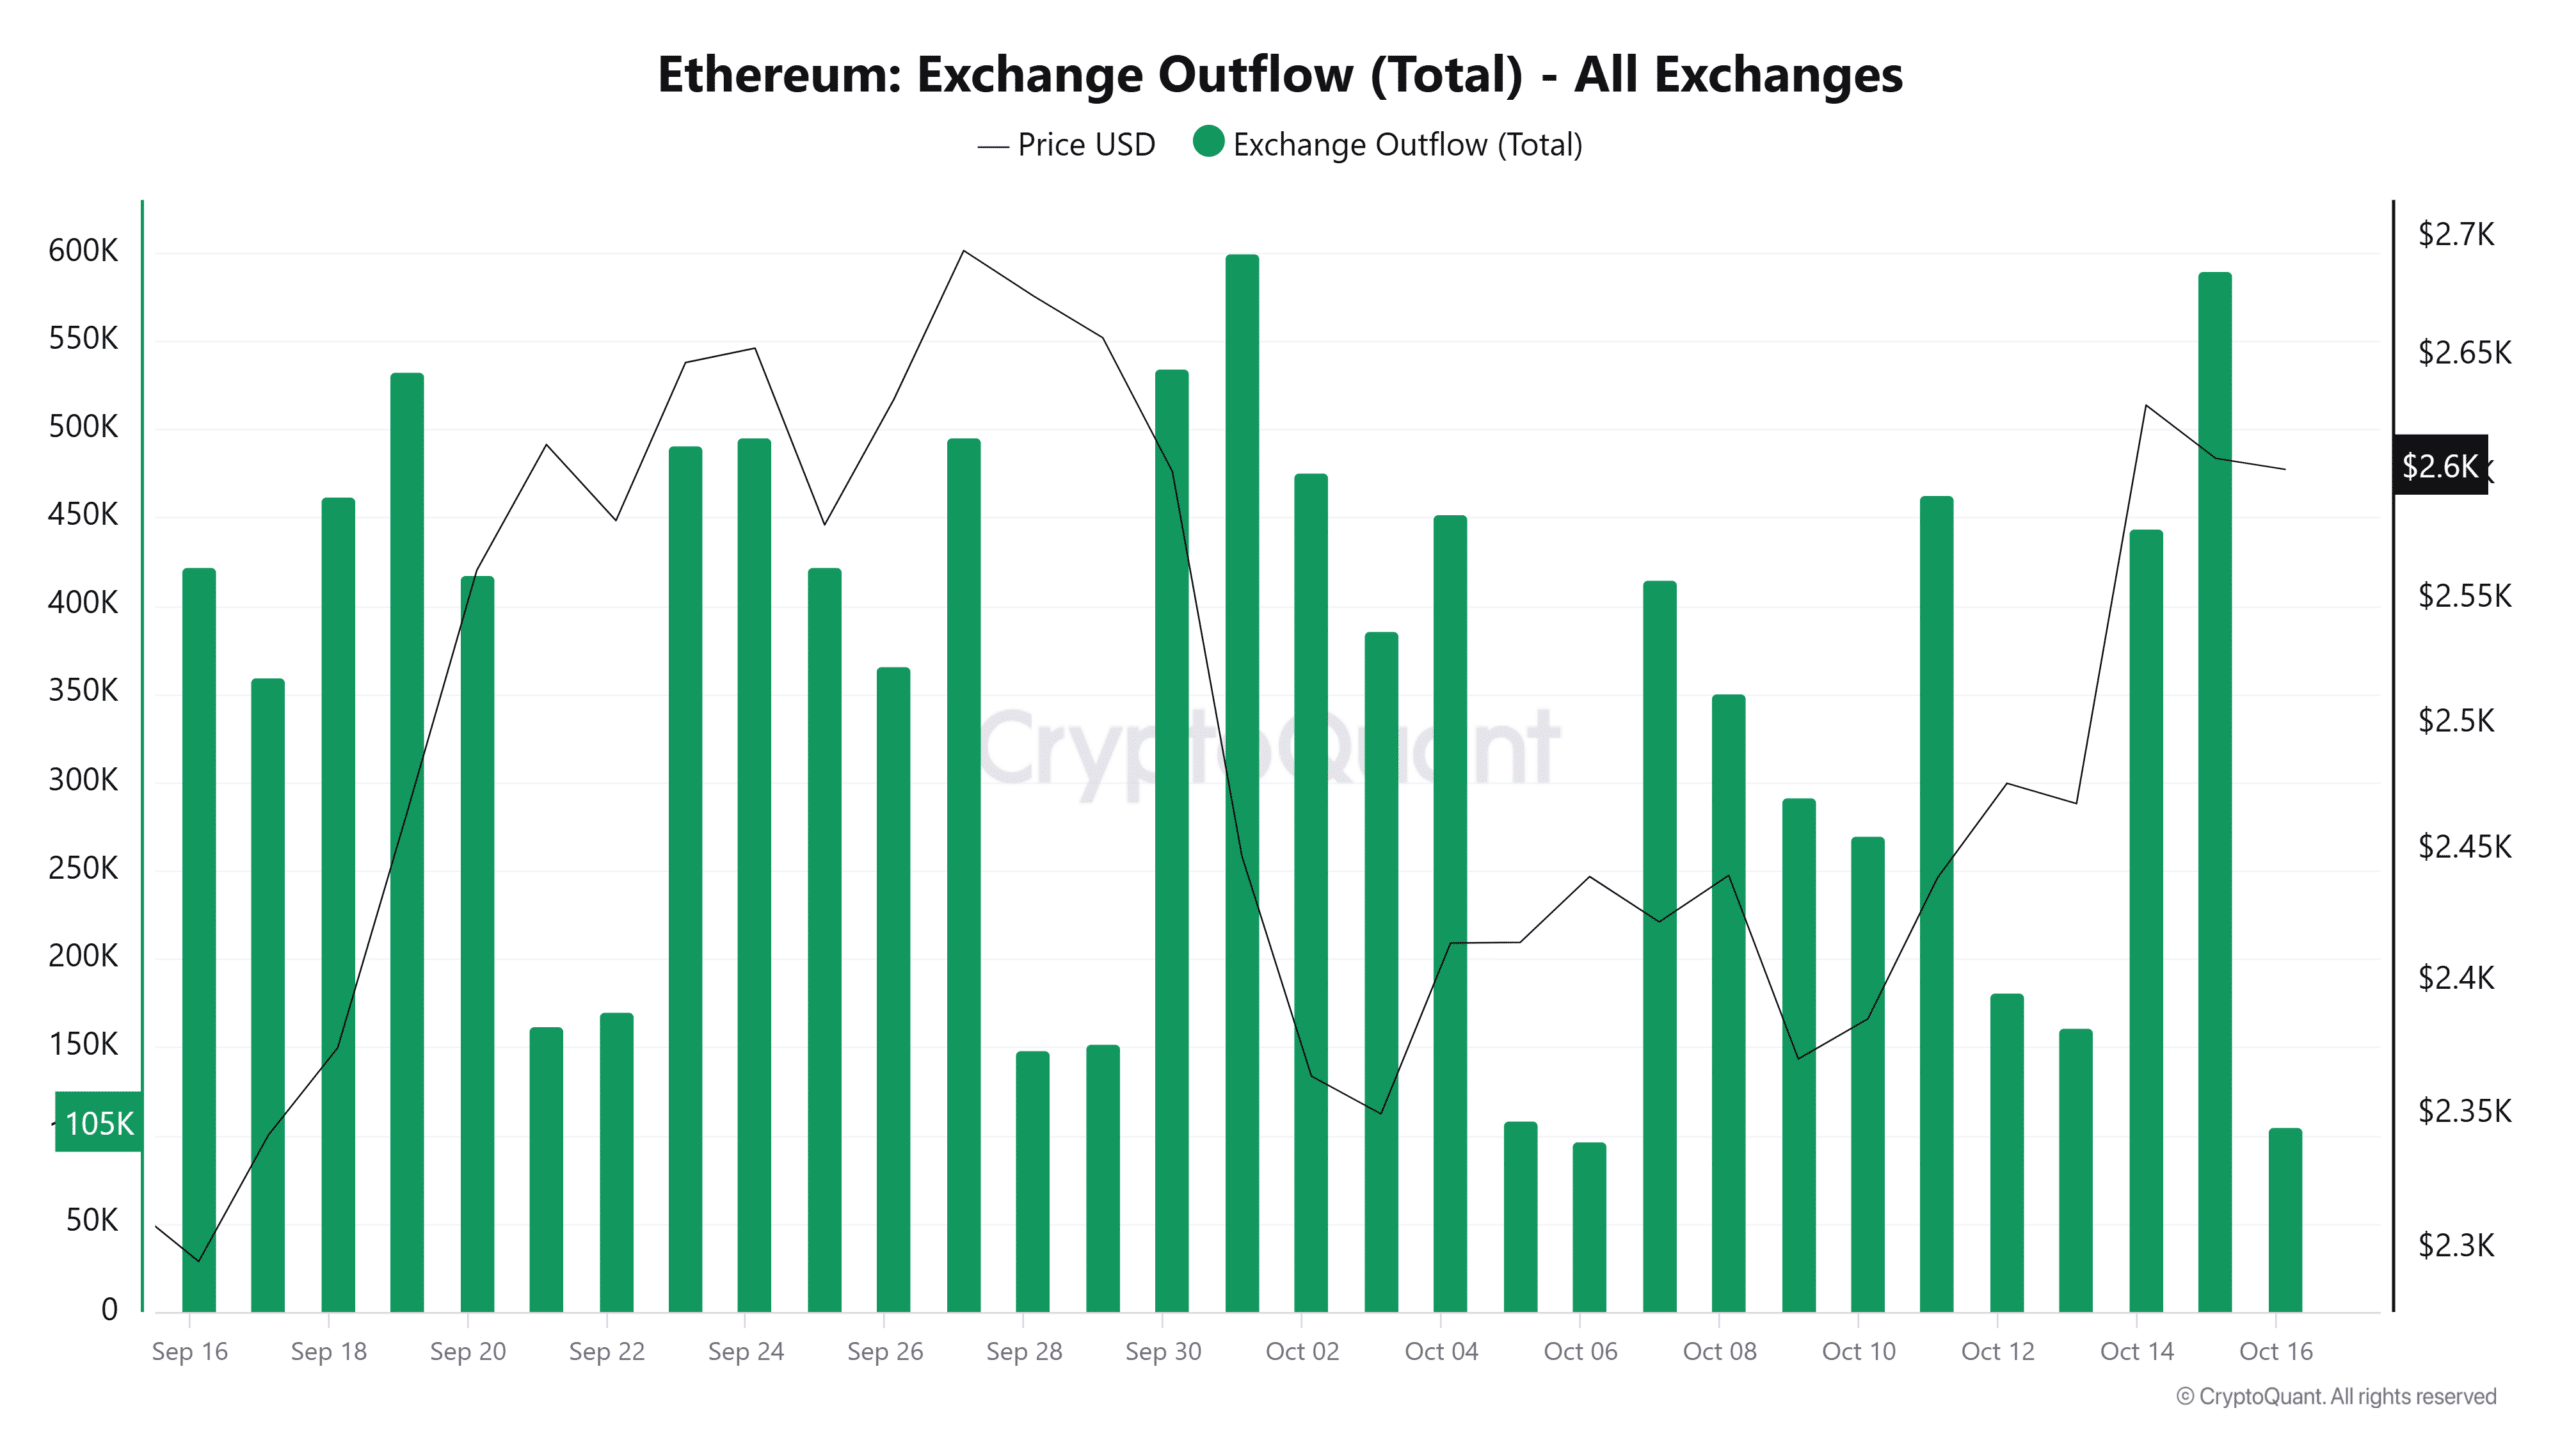
Source: CryptoQuant
Consequently, the total Ethereum netflows reached the highest level since late September, suggesting that selling pressure on ETH could subside, paving the way for a price recovery.
Risining Open Interest
Ethereum’s Open Interest could also influence the price action. Ethereum’s OI stood at $12.76 billion at press time, showing growing market participation and interest from derivative traders.
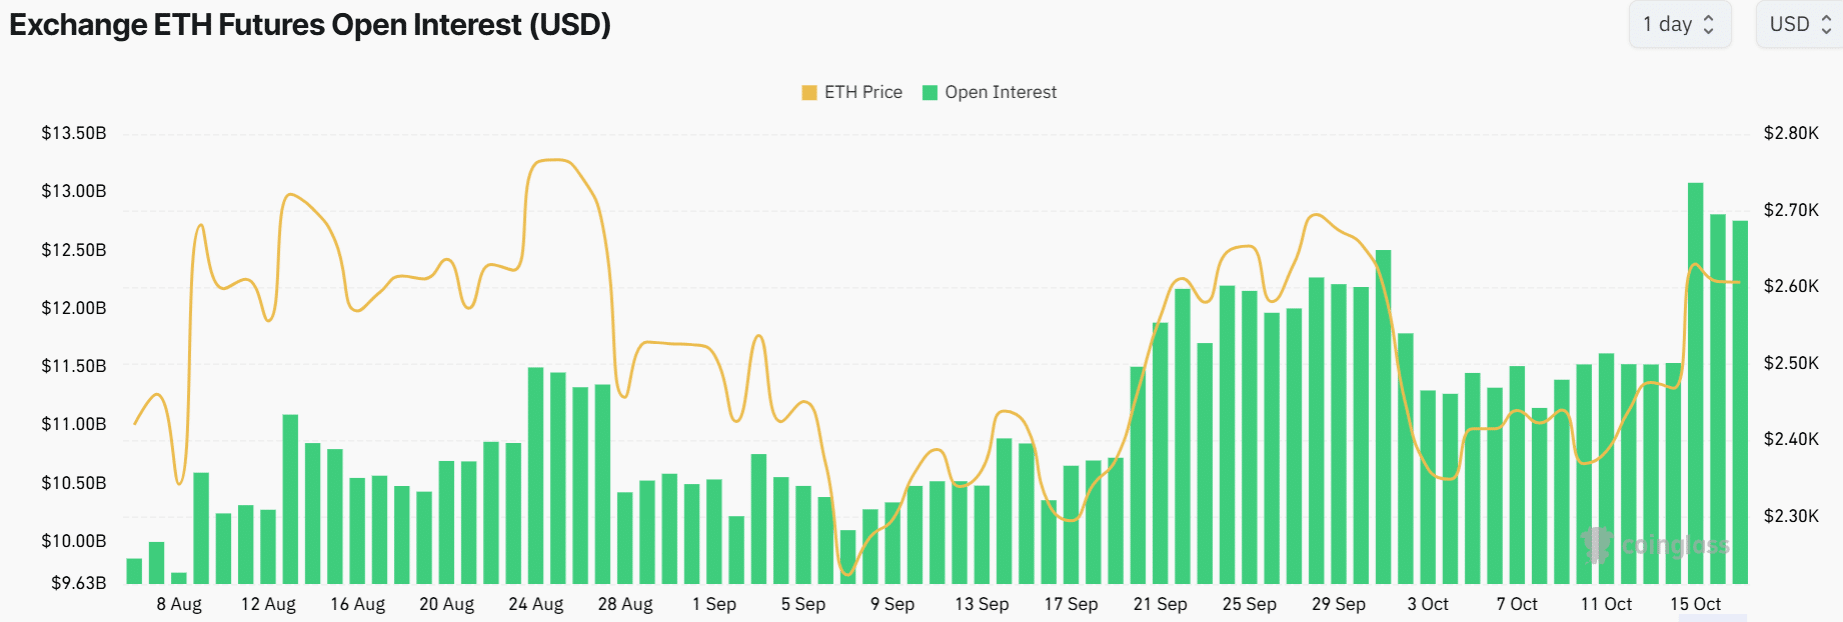
Source: Coinglass
A surge in Open Interest amid a lack of significant price changes indicated that speculative activity towards ETH was increasing.
This could result in high volatility if traders begin to close their positions if the price makes a strong move in either direction.
Active addresses show bullish signs
The number of active addresses on Ethereum reached 349,507 on the 15th of October, the highest level in the last month. This spike is bullish as it can show rising demand for ETH or growing network activity.
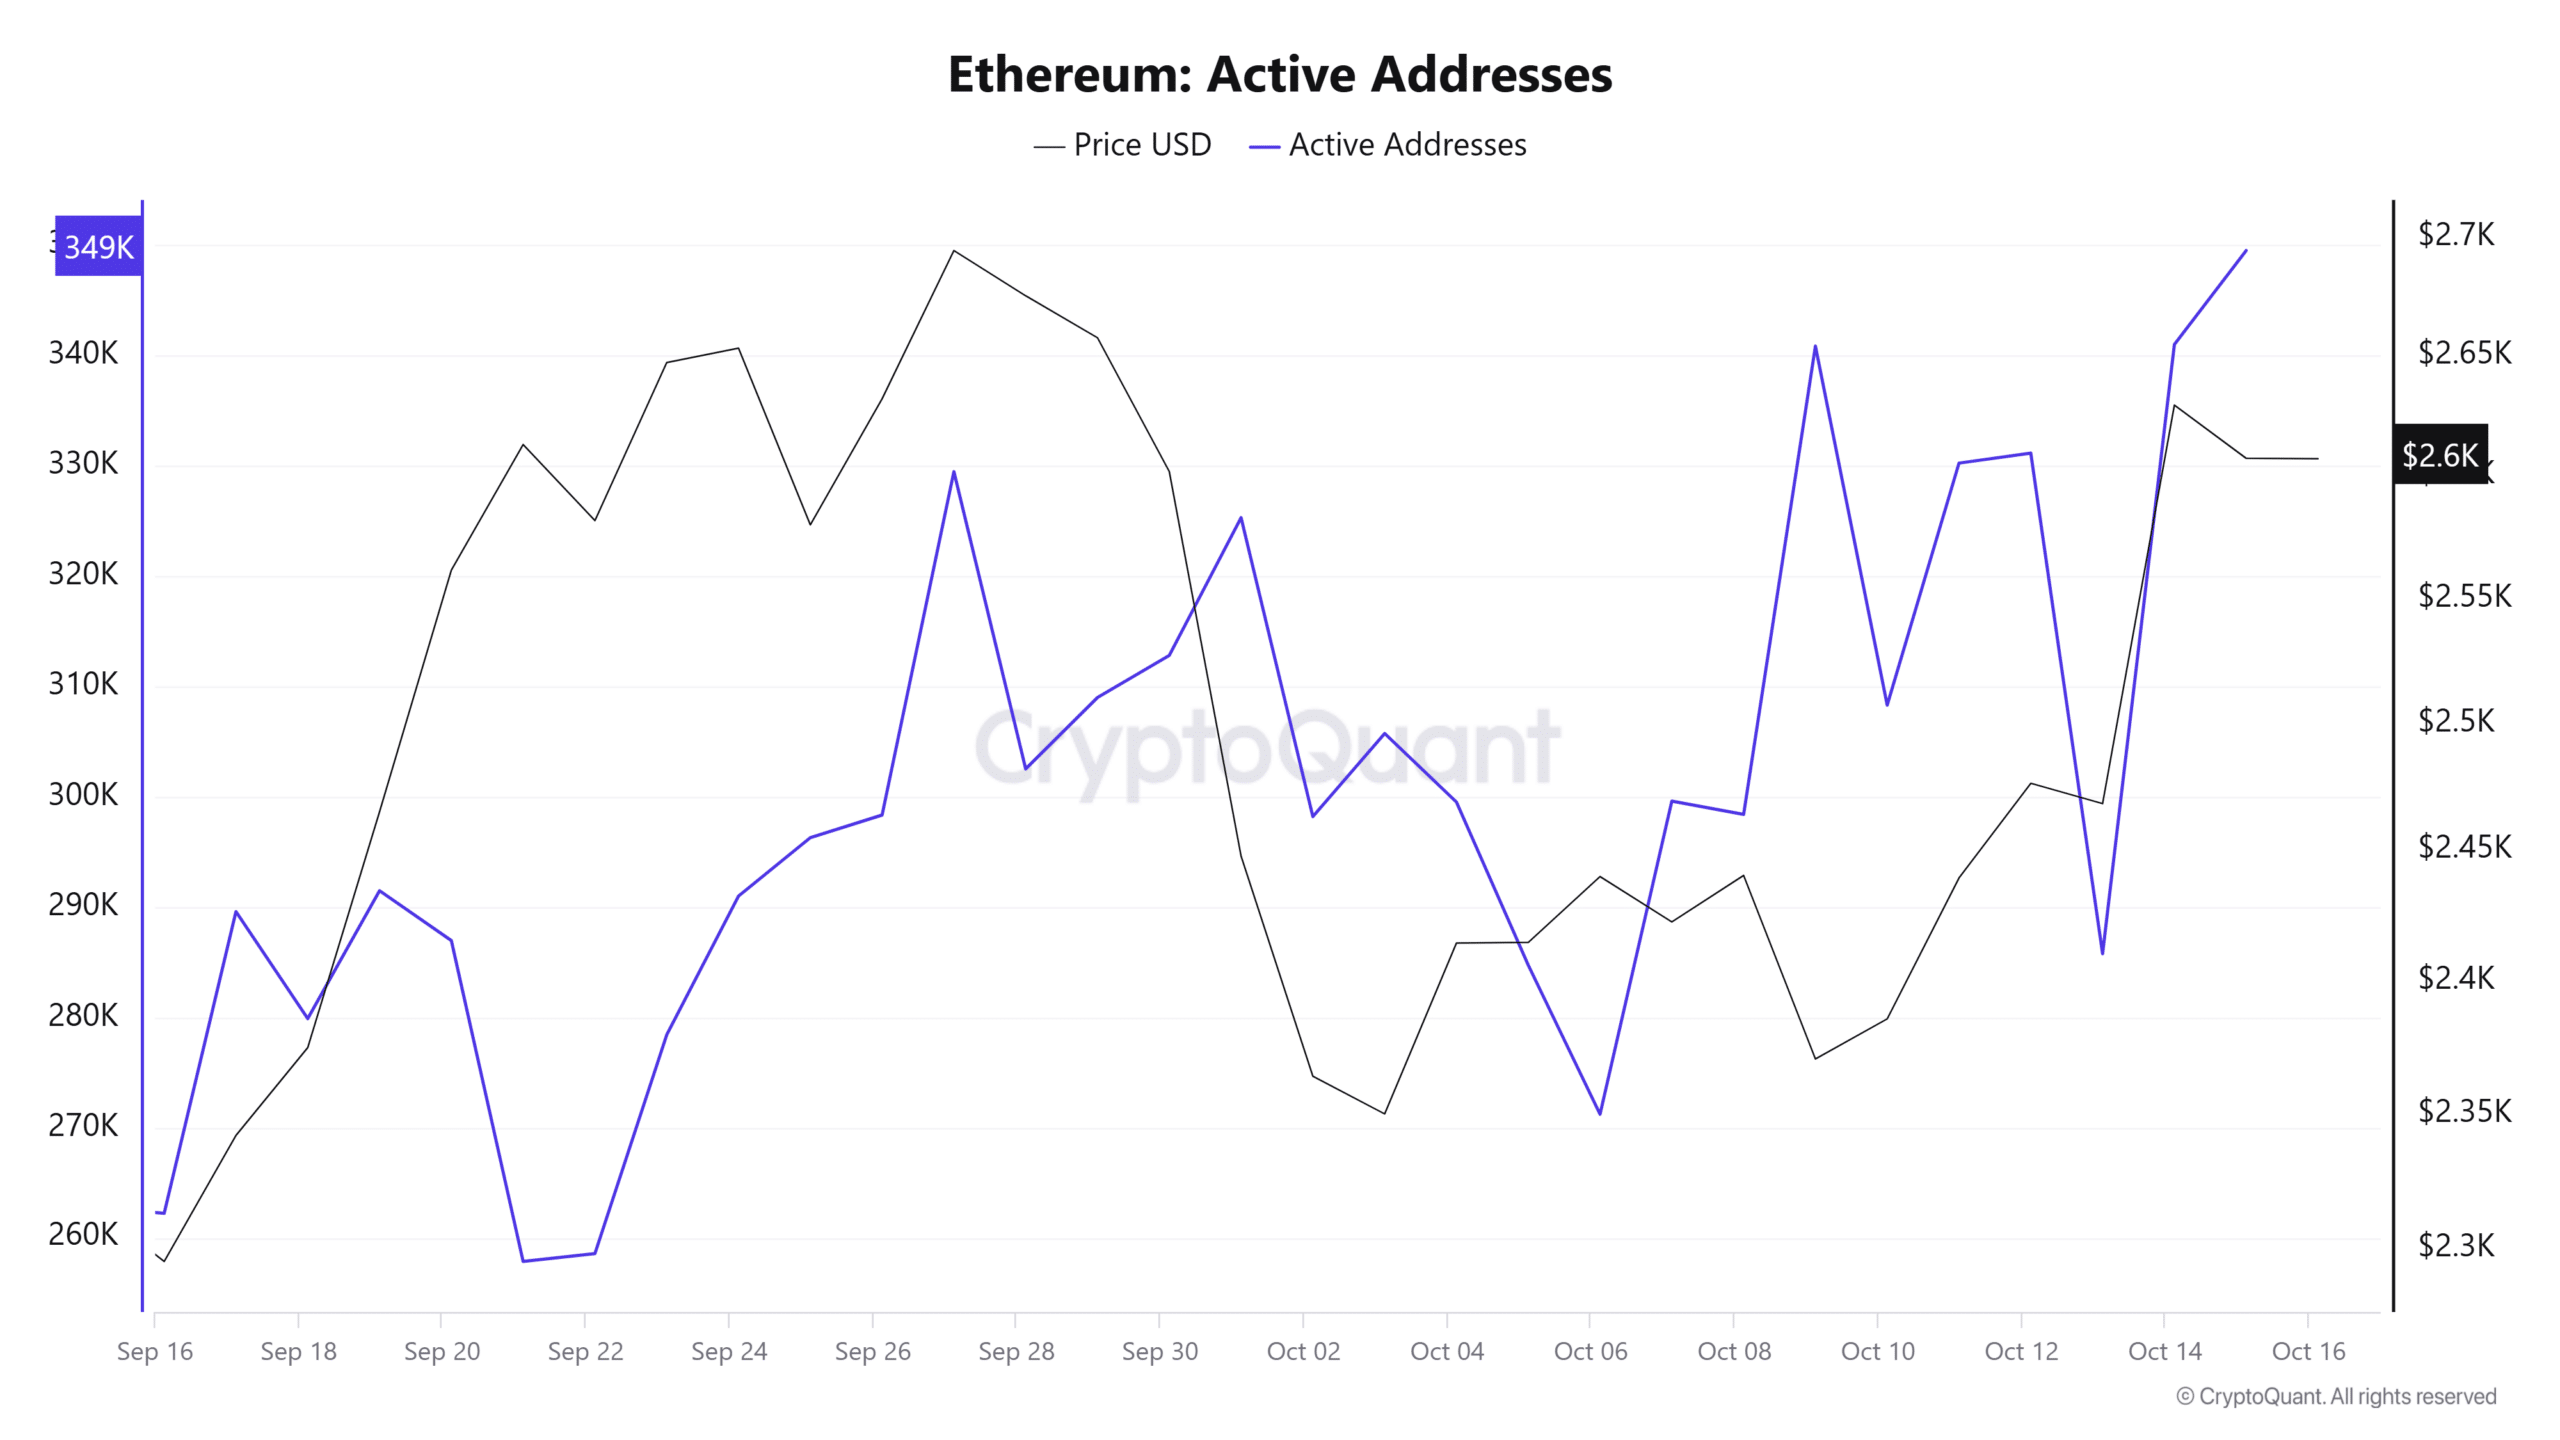
Source: CryptoQuant
The increase in these addresses also coincided with rising profitability.
Read Ethereum’s [ETH] Price Prediction 2024–2025
Data from IntoTheBlock showed that after the recent gain in price, the daily active addresses that are in profits reached 30%, the highest level in the past month.
At the same time, the daily active Ethereum addresses in losses have dropped to 13%.
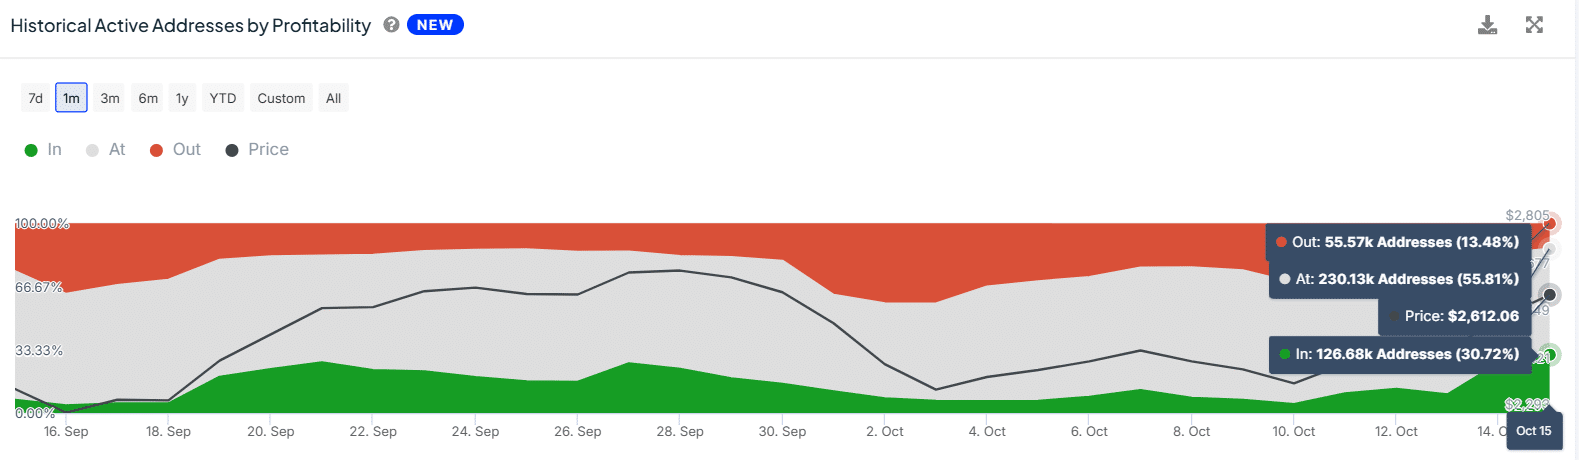
Source: IntoTheBlock