Can Fantom retain its bullish trajectory despite market fluctuations?
The $0.66 and $0.9 zones were the next pivotal resistance zones and were a notable supply zone earlier this year.
- Fantom has a strongly bullish outlook.
- The liquidity charts showed the uptrend is likely to continue after a brief consolidation.
Fantom [FTM] saw a strong increase in its trading volume a week ago, and this trend has only strengthened in the past few days. Increased activity on the Fantom network with rising dApp volumes was also encouraging.
The token was trading below a bearish breaker block, but its momentum and trade volume meant a breakout would likely occur in the coming days.
Fantom technical indicators underline bullish might
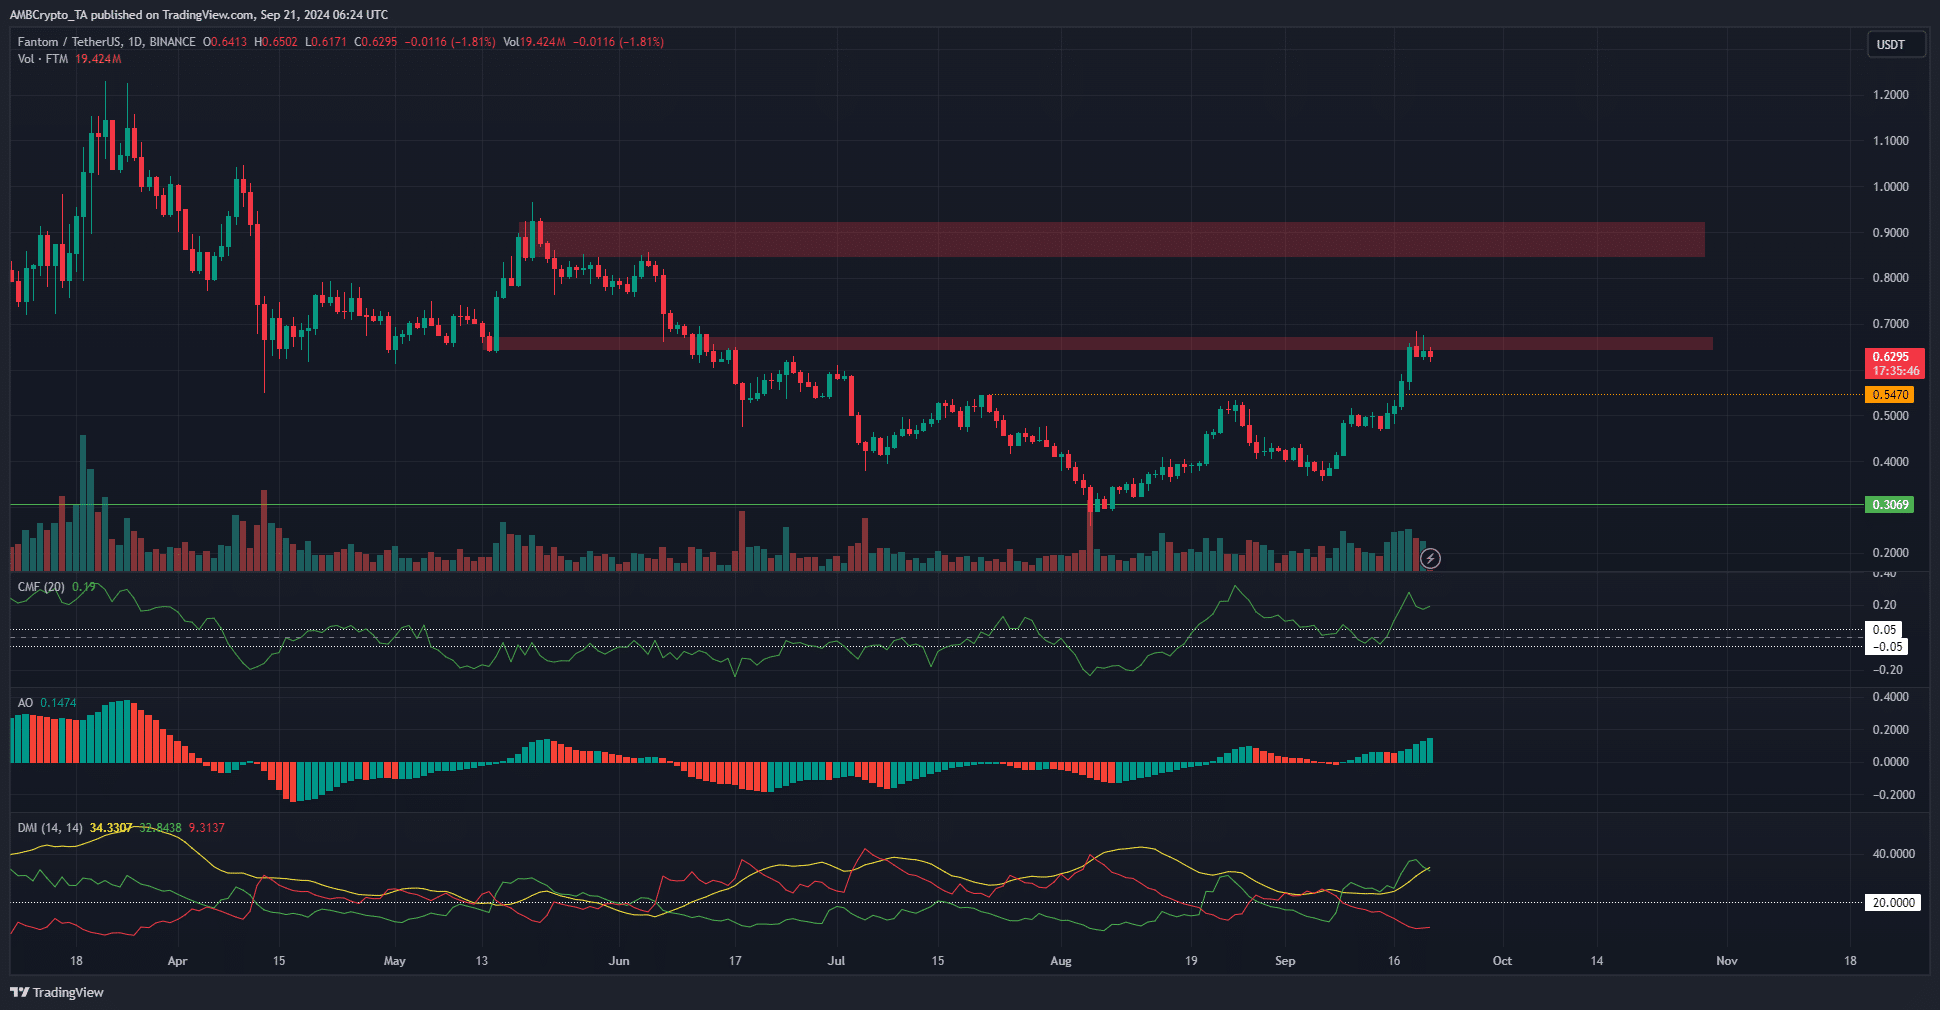
Fantom has broken the local highs at $0.54 that have been in play since July. In doing so, the daily market structure was also flipped bullishly. The Directional Movement Index also signaled a strong uptrend in progress.
The indicator’s +DI (green) and ADX were both above 20 to show the uptrend was significant. The Awesome Oscillator reflected the bullish momentum of the past week that saw Fantom post 44.7% gains in four days before a minor pullback from $0.683 to $0.633.
The CMF was at +0.19 to showcase sizeable capital flow into the Fantom market. This increased demand in the past week reinforced the strength of the bulls, and made a breakout past $0.66 more likely.
The $0.66 and $0.9 zones were the next pivotal resistance zones and were a notable supply zone earlier this year. A break and retest of the $0.66 zone should offer swing traders a buying opportunity.
Liquidation heatmap shows key levels were swept
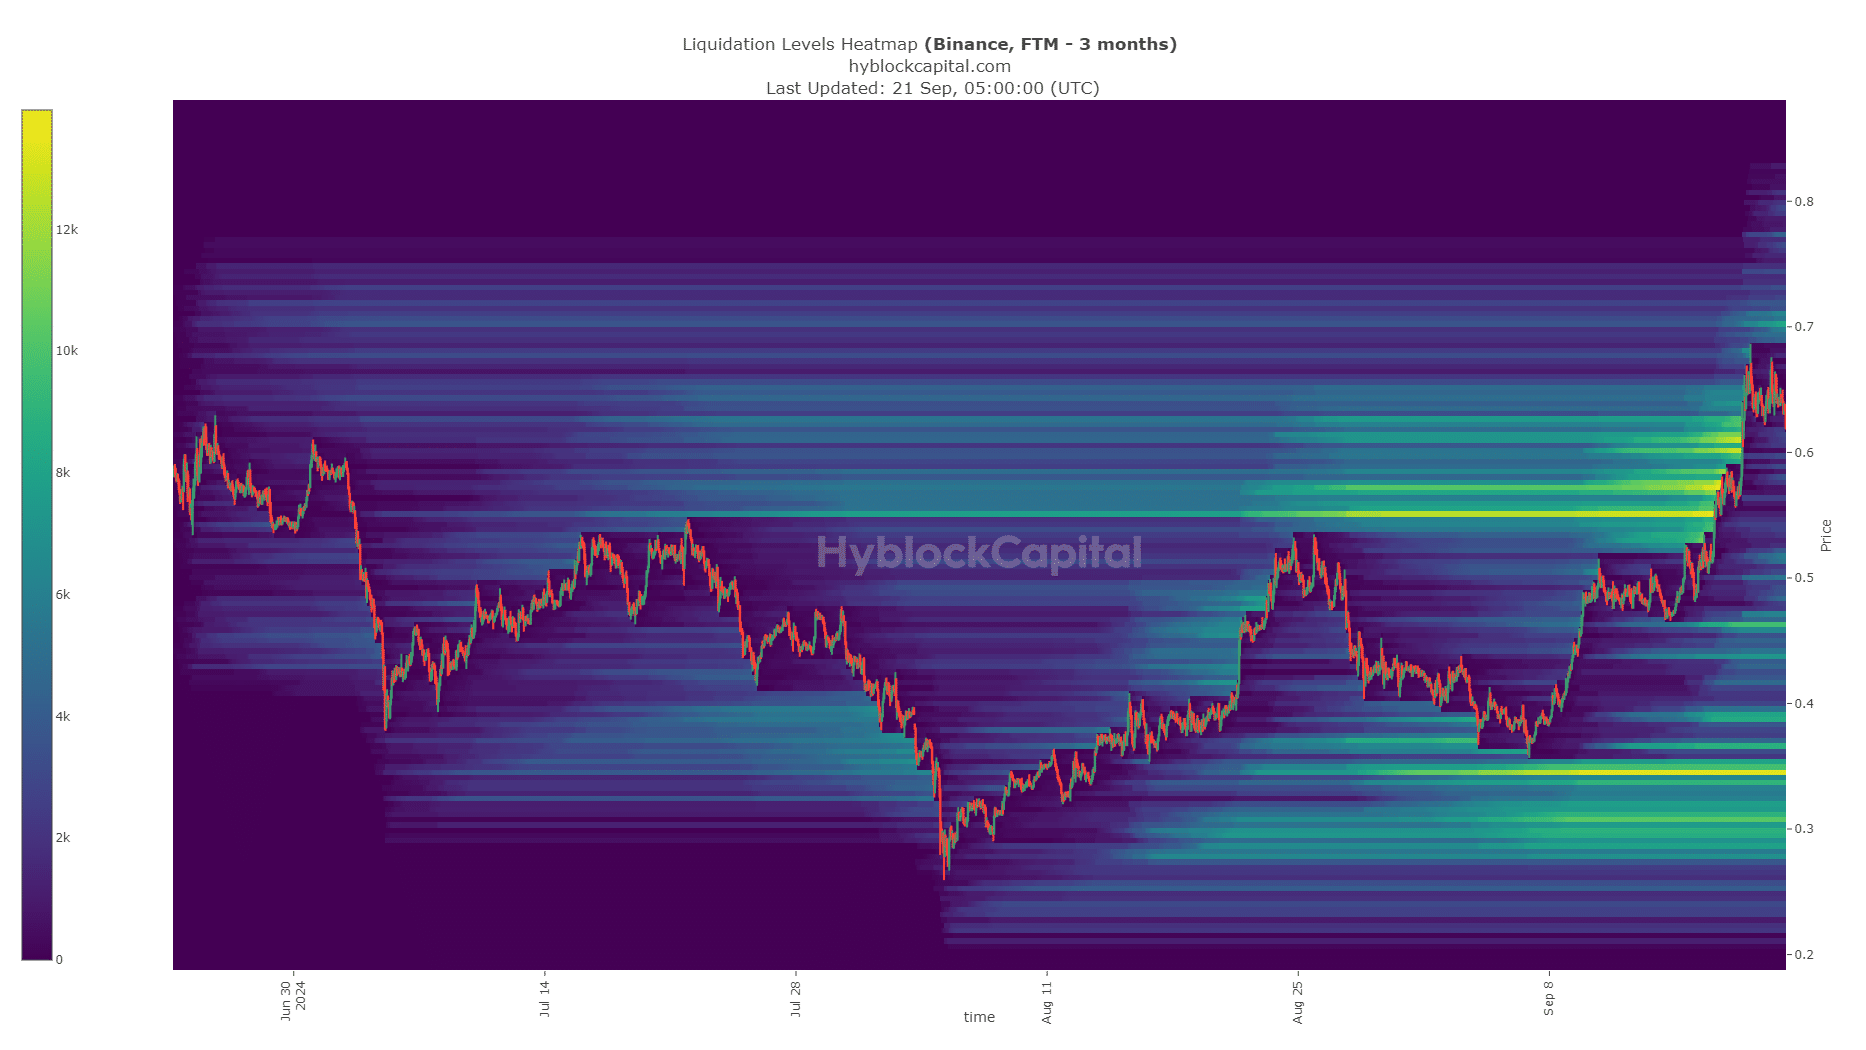
The liquidation heatmap outlined a large pool of liquidity that extended from $0.546 to $0.626. During the rally of the past week, this zone was swept and price began to consolidate around the $0.63 area.
Is your portfolio green? Check the Fantom Profit Calculator
Usually, such an explosive move consolidates for a short while, then retraces a small part of the move to engineer liquidity above the local highs before moving higher to hunt the late short sellers.
If this scenario plays out, Fantom could see a minor retracement toward $0.57-$0.58 before resuming its rally.
Disclaimer: The information presented does not constitute financial, investment, trading, or other types of advice and is solely the writer’s opinion