Can Harmony find demand above this level and what to expect if it does

Disclaimer: The findings of the following analysis are the sole opinions of the writer and should not be considered investment advice
Bitcoin has been volatile in recent days as bulls and bears fought for control of the $39k area. A move past $39k-$40k for Bitcoin could see some life from the bulls. On the other hand, the macroeconomic conditions of inflation, uncertainty, and fear did not paint a pretty picture in the long term for the crypto sphere and also for Harmony.
ONE has seen a strong drop in January and its downtrend has not been stemmed yet. However, it was trading above a support level and a demand zone- and could see a bounce soon.
ONE- 1D
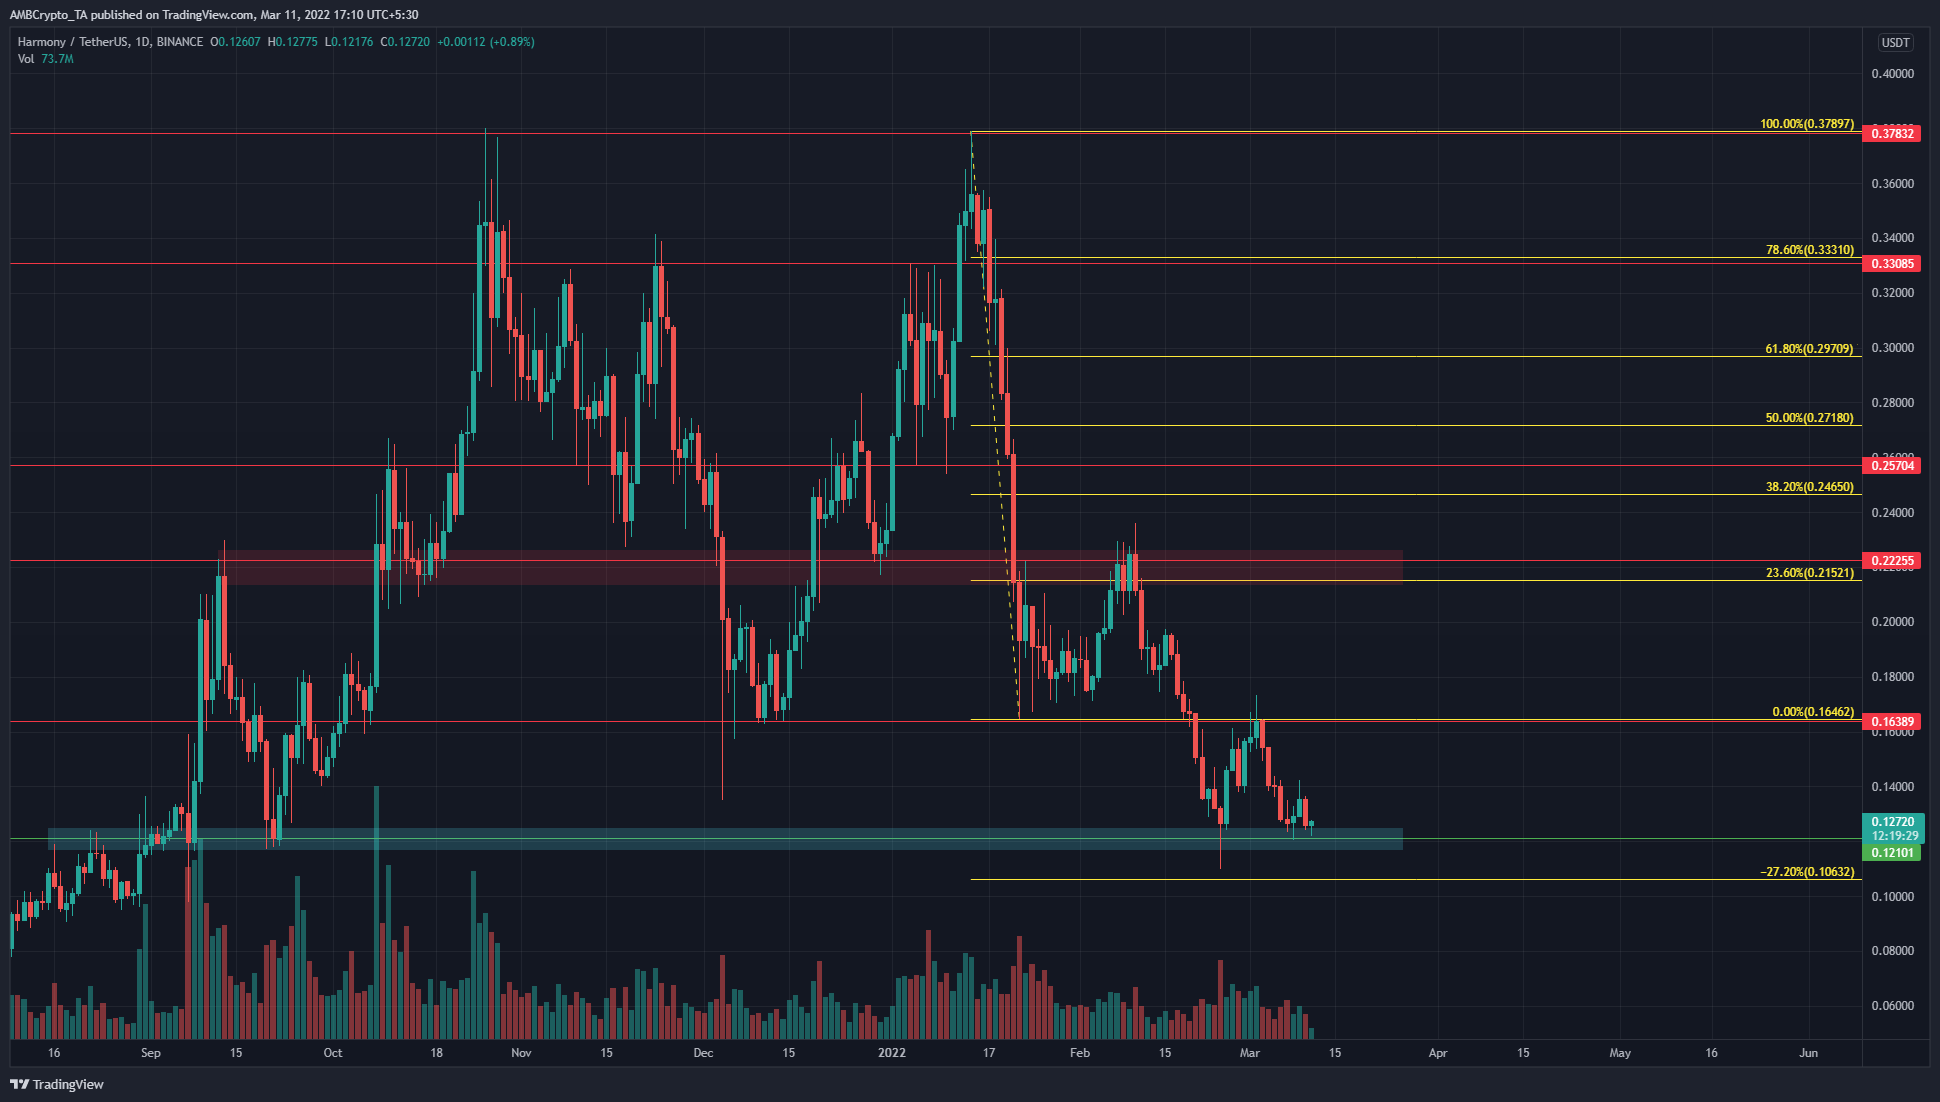
Within the past month, the $0.164 level has been flipped from support to resistance and retested as confirmation of resistance in the past couple of weeks as well. This did not bode too well for ONE. However, it also offered the possibility that price would range between the $0.121 support and $0.164 resistance, in a slightly volatile phase of accumulation in the weeks to come.
Therefore, the $0.121 level and the $0.106 level, which is the 27.2% Fibonacci extension level, can likely halt the advance of the bears at least temporarily. To flip the bias to bullish, a longer-term investor would need to see ONE break above $0.164 and flip it back to support.
Until then, the outlook would be bearish on the daily timeframe. To the south, the $0.106 and $0.098 levels could serve as support.
Rationale
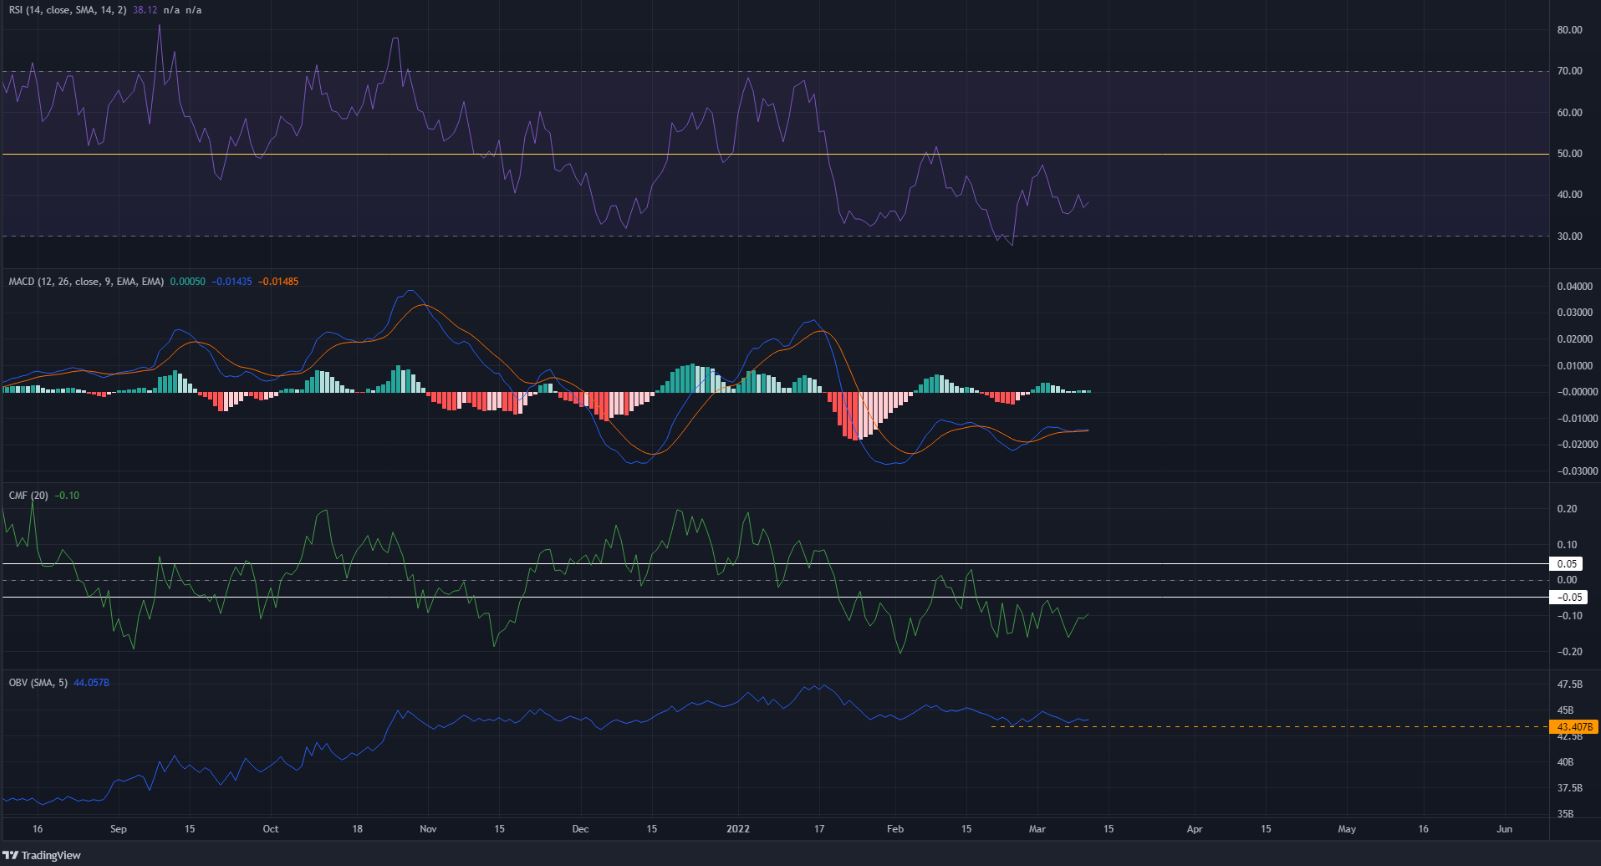
The RSI continued to remain beneath the neutral 50 line and was at 38, at the time of writing. This showed bearish momentum was strong. However, in the past couple of weeks, the price formed equal lows at $0.125 while the RSI made higher lows. This exaggerated bullish divergence could spark a bounce.
The MACD was also beneath the zero line to highlight the overall bearish pressure in the past couple of months. The CMF showed significant capital flow out of the market, while the OBV was moving sideways and lower.
Conclusion
The indicators showed that selling pressure had the upper hand. It was possible that Harmony could see a bounce from the $0.121 long-term support level, but its trend and market structure remained bearish. The $0.16 area would have to be flipped from supply to demand in order to change this longer-term bias.