Can LINK’s buyers absorb incoming sell-side pressure after 52% November gains?

- Chainlink’s exchange supply ratio gradually rose to a one-month high as wallet profitability climbed
- Open interest surged to its highest level since April too
November delivered significant gains for most altcoins, including Chainlink (LINK), with the crypto trading at $18.63 at press time. In fact, after gaining by around 5% in the last 24 hours alone, LINK’s monthly gains have now surpassed 52% on the charts.
These gains seem to have stirred profit-taking activities, with the same highlighted by the rising exchange supply ratio. Data from CryptoQuant revealed a gradual uptick in this metric to a monthly high of 0.161.
When this ratio rises, it points to an increase in LINK tokens being sent to exchanges – A sign of rising sell-side pressure. This can be a bearish sign, especially if there is no uptick in buying activity to absorb the sold coins.
Here, it’s worth pointing out that the hike in the exchange supply ratio coincided with rising wallet profitability. According to IntoTheBlock, 64% of LINK holders are now in profit – A significant jump from 36% towards the beginning of November.
At the same time, wallets in losses dropped from 59% to 29%.
Rising wallet profitability can also be good for the price as it can lead to positive market sentiment.
However, for LINK to continue its uptrend, it needs a surge in buying activity.
Chainlink price analysis – Are buyers active?
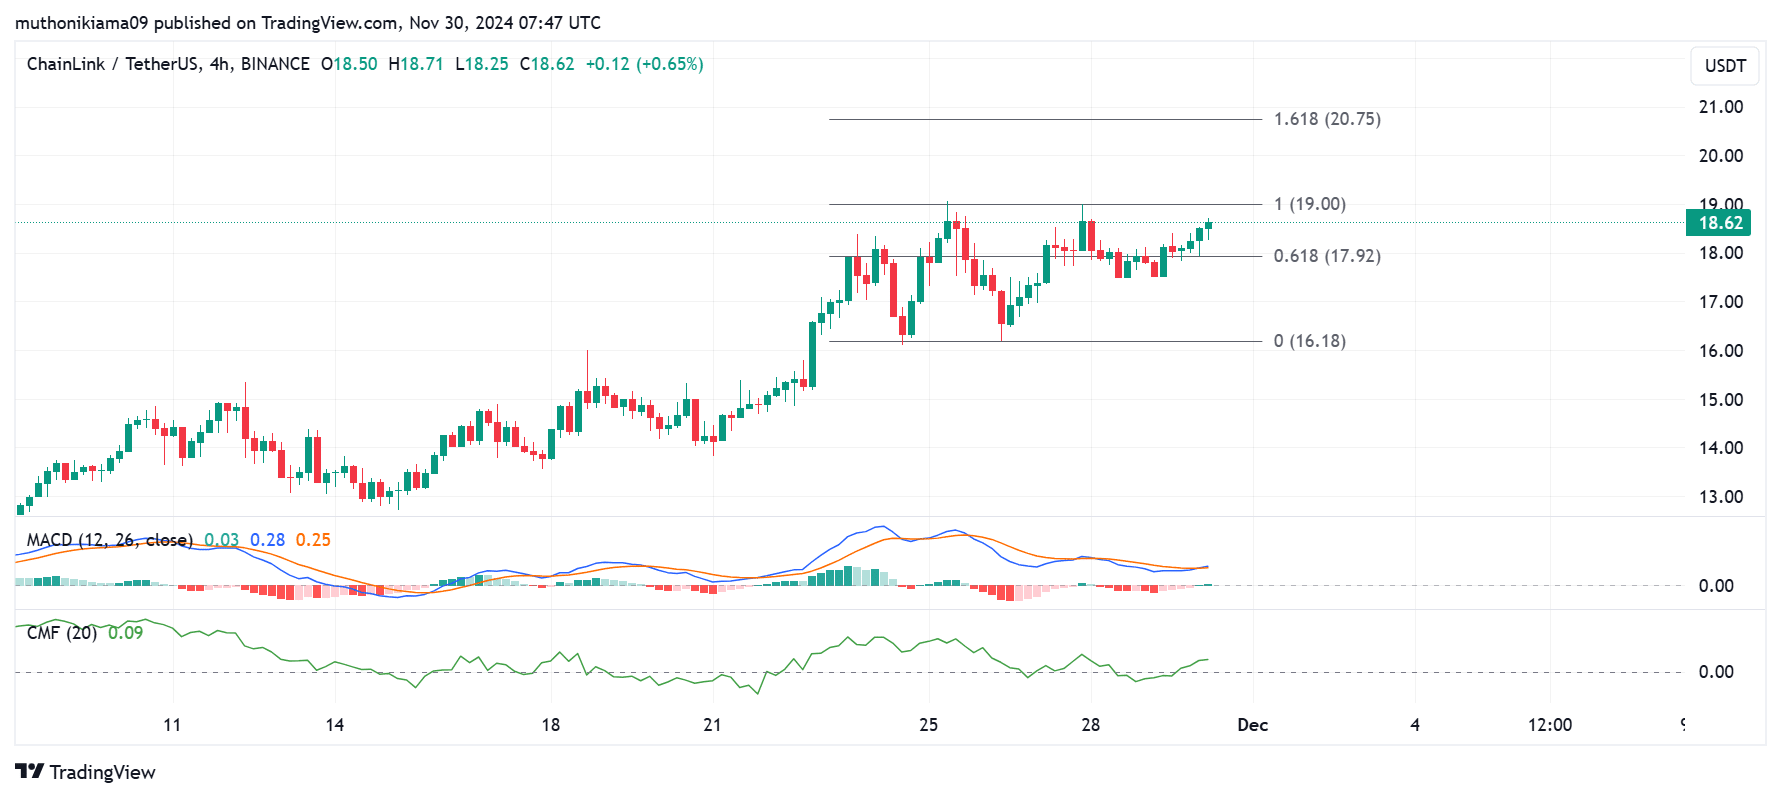
Chainlink’s four-hour chart revealed that buying pressure has been greater than the selling pressure. This was evidenced by the Chaikin Money Flow (CMF) indicator which had a positive value of 0.02. The CMF was also tipping north, suggesting that more buyers have entered the market recently.
The Moving Average Convergence Divergence (MACD) line also created a buy signal after crossing above the Signal line. If the MACD line continues to trend above the Signal line, it could strengthen the altcoin’s bullish trend.
If buyers manage to push LINK past the resistance level at $19, the token could aim for $20.75. However, Chainlink has been rejected at this support level several times, with more buying volumes needed to support a breakout.
At press time, the number of active addresses suggested that buying volumes were low. According to IntoTheBlock, these addresses dropped by nearly 50% in one week from 7,420 to 4,210. New addresses also declined from 2,650 to 1,530.
Open interest approaches 8-month high
On the derivatives market front too, Chainlink has seen a surge in activity. In. fact, Open Interest (OI) climbed to its highest level in more than seven months.
LINK’s OI, at press time, stood at $396M – An indication that derivative traders are opening new positions on the altcoin.
Chainlink’s funding rates also surged, highlighting that most of the newly opened positions were by long traders betting on more gains.


