Can long-term Axie Infinity investors remain bullishly biased after recent losses?

Disclaimer: The information presented does not constitute financial, investment, trading, or other types of advice and is solely the writer’s opinion.
- The higher and lower timeframe trends of Axie Infinity were in conflict.
- Long-term buyers need to exercise caution and patience in the coming weeks.
Axie Infinity has been in a downtrend since November 2021. The rally in march 2022 did not break the higher timeframe structure. Yet, the rally in early January was able to break this long-term downtrend.
Read Axie Infinity’s [AXS] Price Prediction 2023-24
That did not mean AXS is ready to rip its way upward and post triple-digit gains soon. Instead, it indicated that long-term investors can explore the possibility of accumulating the token.
The $8-$9 region was especially important as a zone of demand. Can AXS recover the losses it incurred in February?
The daily market structure meant the trend pointed upward
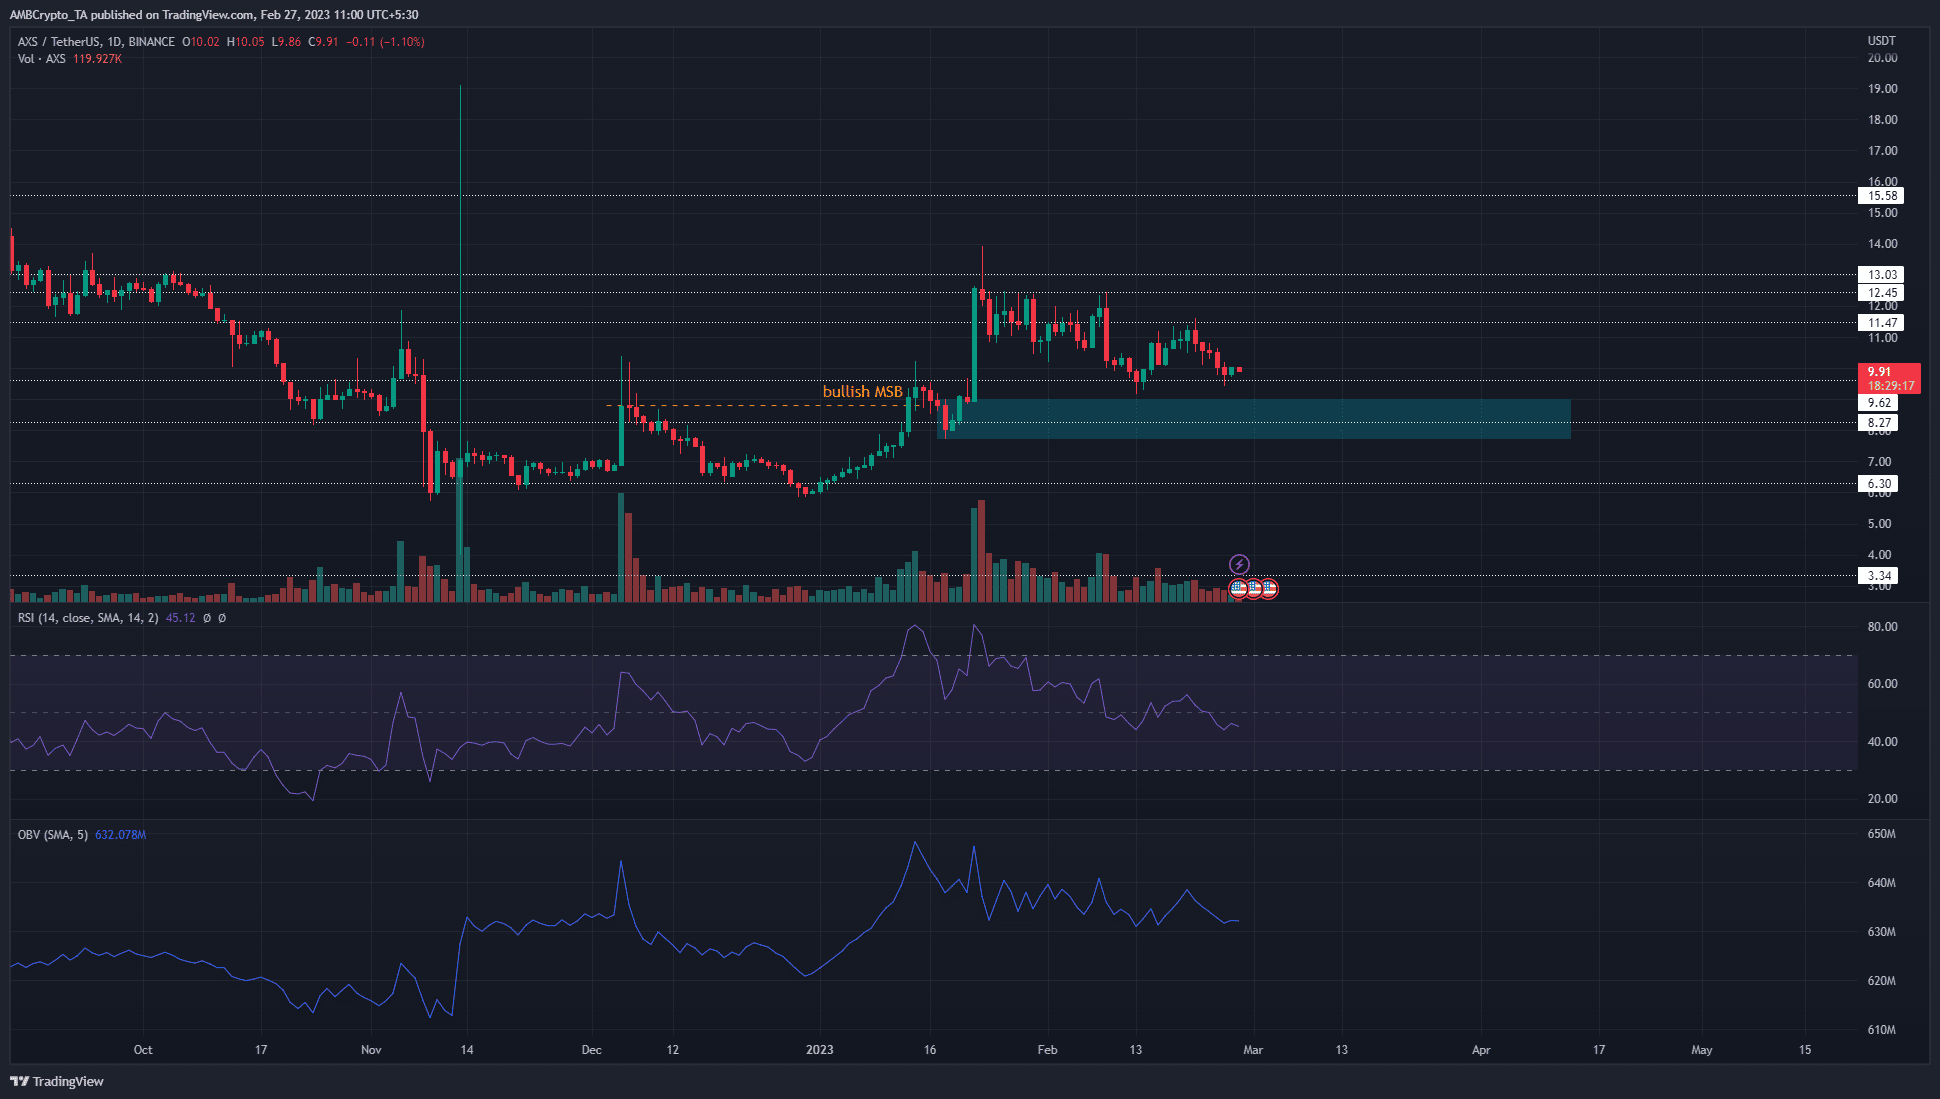
The bullish market structure break occurred in mid-January and was highlighted in orange. Thereafter, the price formed a bullish order block (cyan) before shooting as high as $13.94 just a week after the structure break.
This showed strength from the Axie Infinity buyers. Since then, most of those gains retraced. While this showed profit-taking and some selling pressure, it was unlikely to dominate over the next month. The market has shown bullish strength, and buying opportunities could be rewarded.
Is your portfolio green? Check the AXS Profit Calculator
The RSI was just beneath the neutral 50 mark. It sank from 80.5 to 45 over the past month to highlight steady selling pressure behind AXS. Meanwhile, the OBV has also formed a series of lower highs.
The conclusion was that a retest of the bullish order block at $8-$9 could offer longer-term buyers an opportunity. Until this retest, buyers can wait, and traders have reason to remain bearish on lower timeframes.
A rise in trading volume and the OBV would be signs that a rally was beginning. If the price closed a daily trading session beneath $7.8, it would invalidate this bullish notion.
The falling mean coin age showed a sell-off across the network over the past month
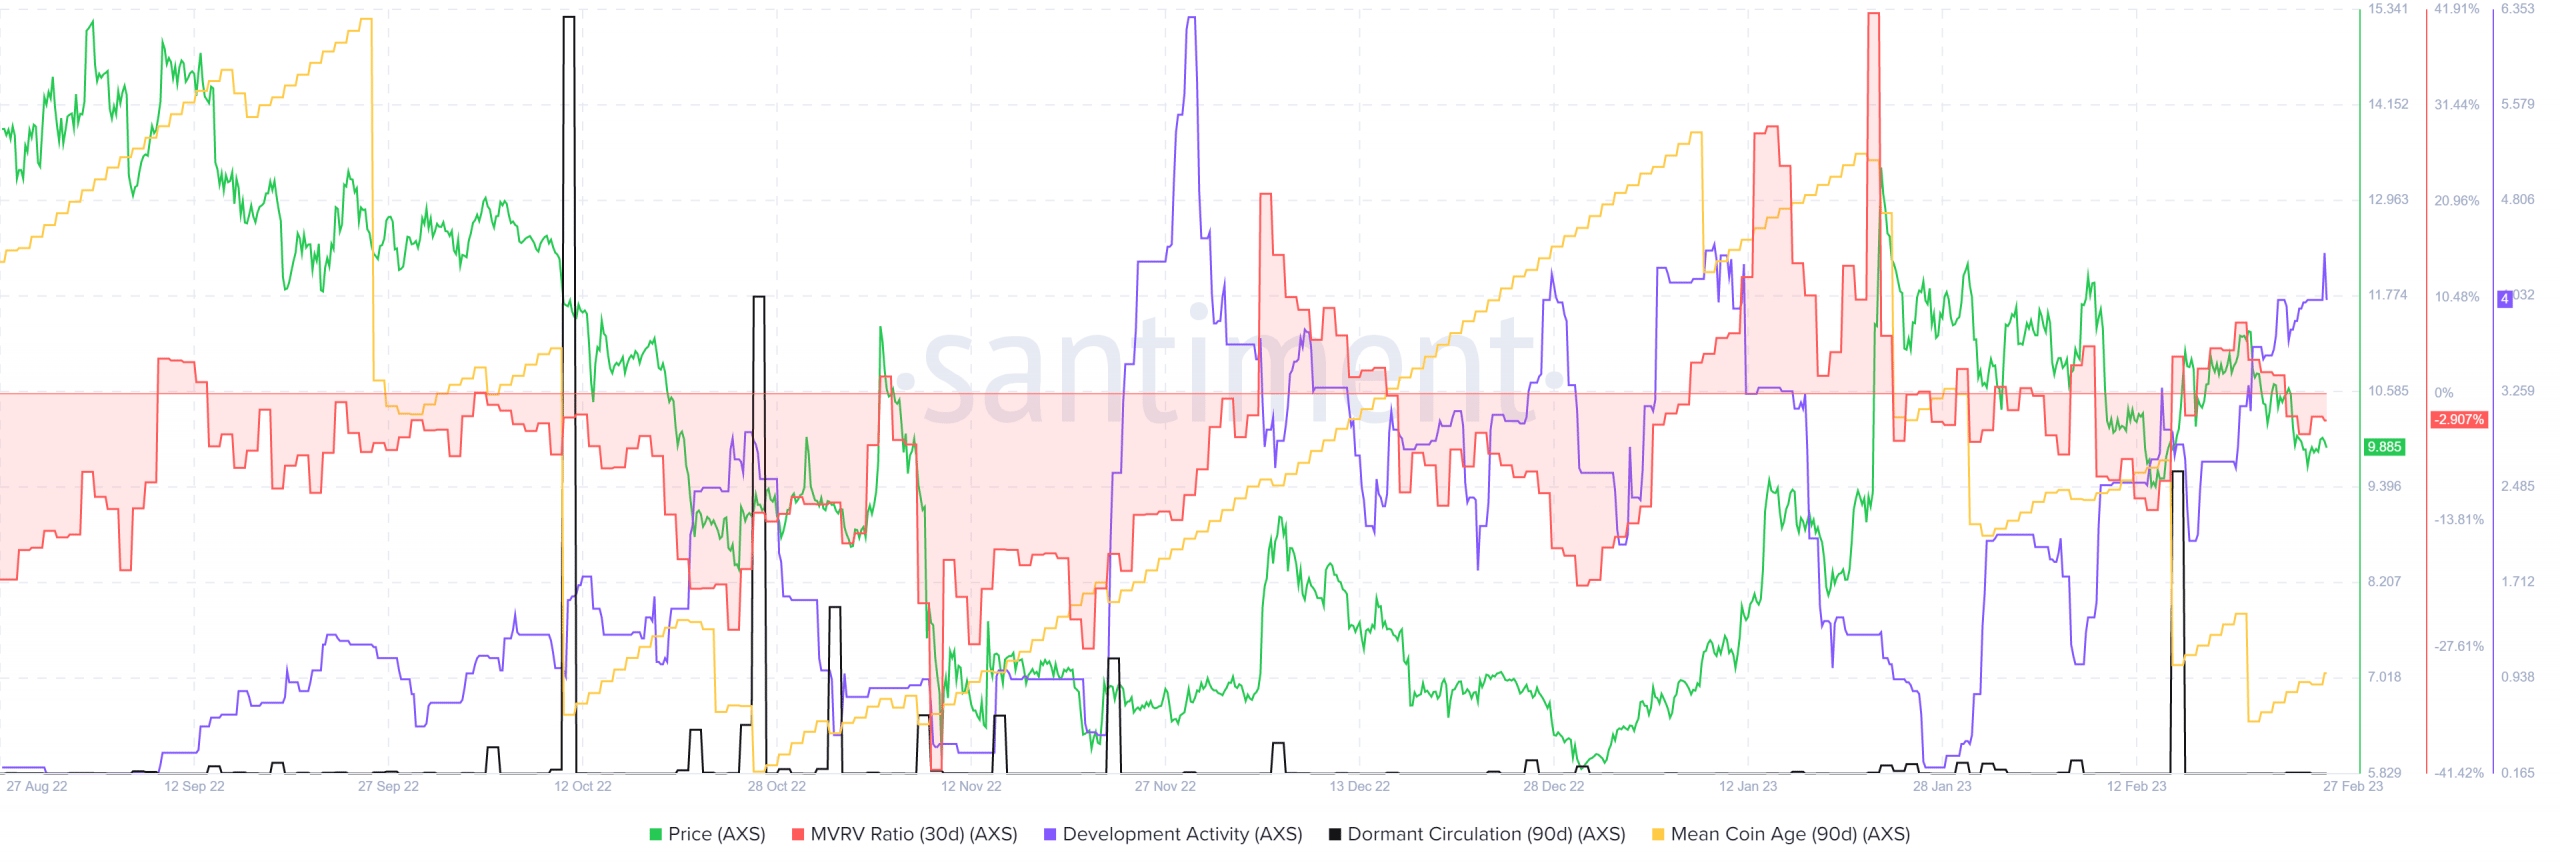
Just like the indicators highlighted steady sell pressure, the mean-coin age metric also showed significant token transfer and a lack of accumulation. This underlined that sellers were likely dominant.
The 30-day MVRV ratio briefly went into positive territory on 20 February. But, AXS hit a resistance level at $11.5 at that time and faced rejection. However, one thing that can encourage investors is that the development activity has been on the rise despite the downtrend in the price.