Can Polkadot’s recovery propel it to new heights?
Despite recent market turmoil, DOT is showing considerable potential for an upward trend.

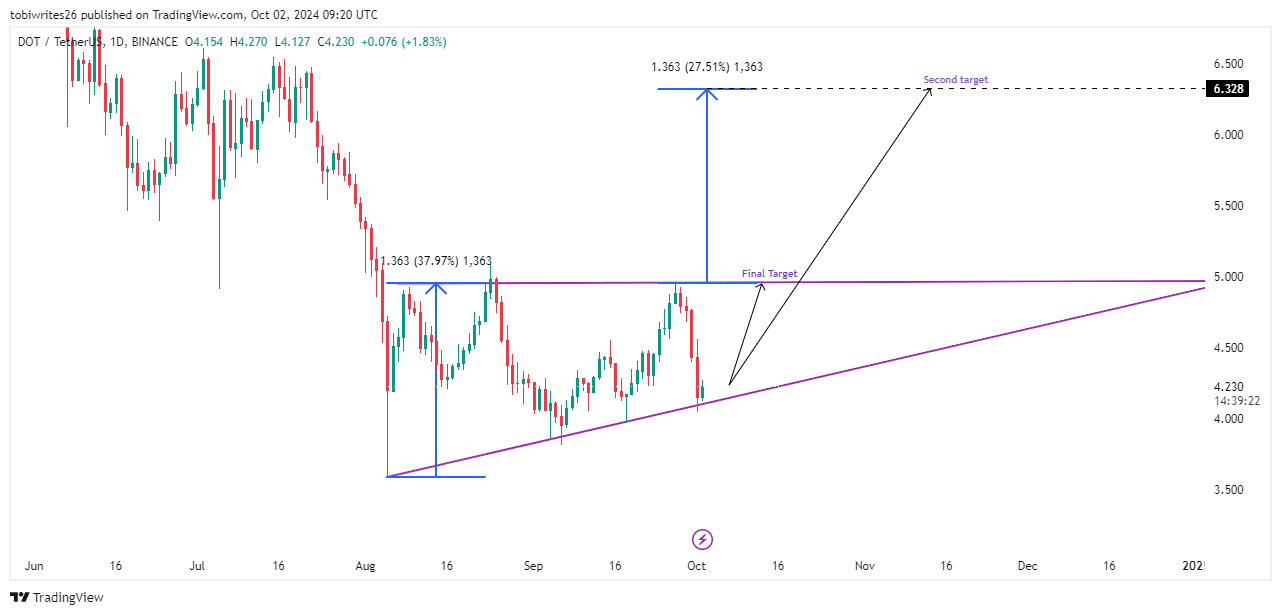
- DOT was trading within a pronounced ascending triangle pattern and has recently bounced off the support line.
- The likelihood of DOT rising to $4.995 and subsequently to $6.328 is supported by several key metrics.
Although Polkadot [DOT] has experienced a 6.13% decline in the last 24 hours, which initially reflected the market’s hesitancy, emerging data suggests this pullback could be a setup for the anticipated increases.
Support level could propel DOT to $4.9
Polkadot has transitioned from a small to a larger ascending triangle pattern, which is characterized by a horizontal upper resistance line and a rising lower support line. This pattern suggests a consolidation of prices leading to a potential breakout.
As of press time, Polkadot has rebounded from the lower support line, a move historically linked to triggering upward momentum. With this support, DOT is expected to climb back to the $4.995 resistance level.
Should the buying pressure exceed the selling at this resistance, DOT is set to advance toward the $6.328 mark. Conversely, a failure to sustain this momentum could see DOT falling to its 2024 low of $3.590, and possibly further to $3.562 if market conditions deteriorate.
Positive developments predict upswing for DOT
AMBCrypto’s recent analysis indicates a likely uptick for DOT from its current trading position.
The Open Interest Weighted Funding Rate (OI) on Coinglass, a key indicator for short-term market trends, has been on the rise, signaling a bullish market sentiment.
This metric assesses market dynamics by analyzing the volume and direction of trader positions, which currently favor an upward trajectory for DOT.
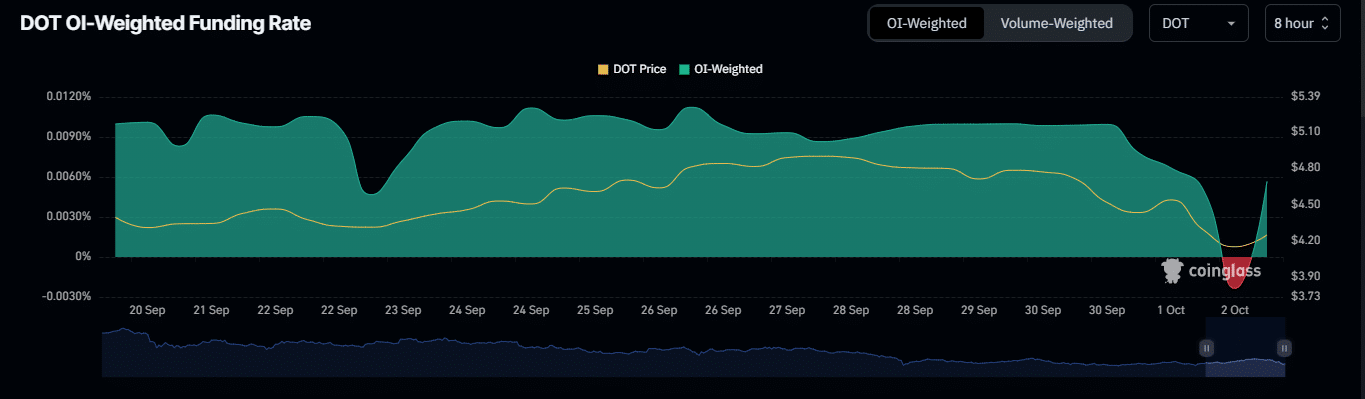
Furthermore, the funding rate, pivotal in ensuring that futures prices mirror the spot price, remains positive at 0.0024%.
Although a positive rate typically leads long position holders to pay shorts—curbing excessive bullish bets—it also reflects the dominant bullish market sentiment.
Bollinger band reinforces bullish sentiment
Using the Bollinger Band (BB) AMBCrypto found DOT remains rally-ready.
The Bollinger Band is a key technical analysis tool, that measures market volatility and price levels. It comprises a middle band, which is a moving average, flanked by two outer bands set two standard deviations away.
Read Polkadot’s [DOT] Price Prediction 2024–2025
Recently, DOT’s price touched the lower Bollinger Band, indicating potential oversold conditions and suggesting a possible rebound.
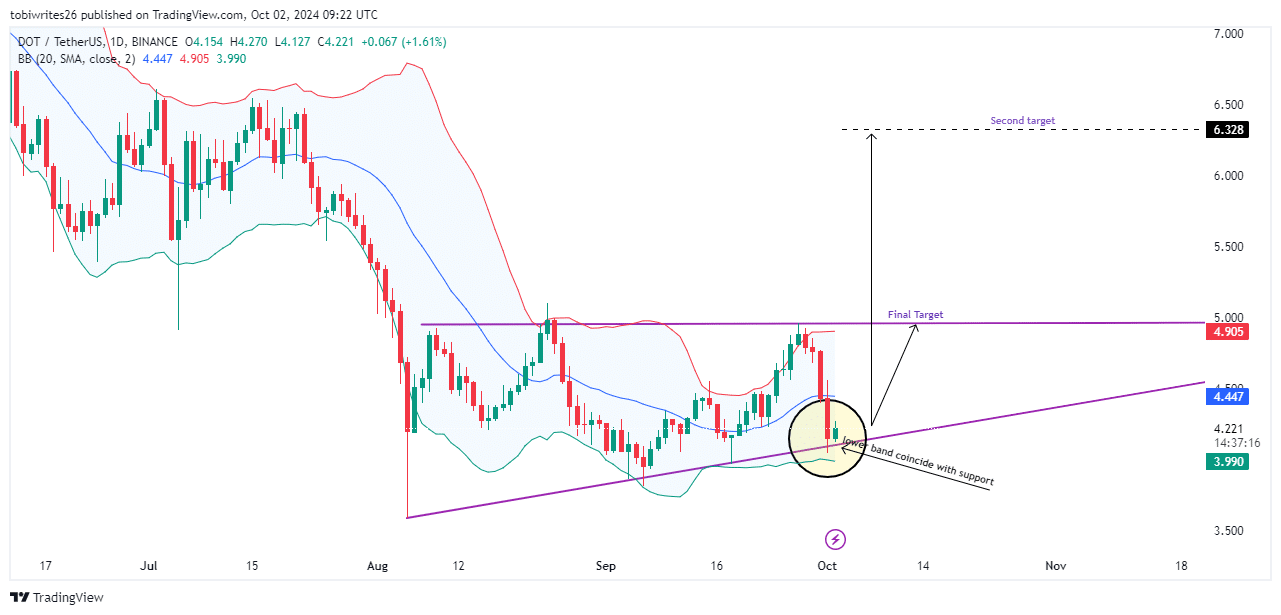
This activity coincides with the support level of an existing ascending triangle pattern, further reinforcing the likelihood of an upward movement in DOT’s price.


