Analysis
Can Polkadot’s reversal extend to $4?
Polkadot has been on a long-term downtrend. Is the price reversal at $3.6 sustainable?

Disclaimer: The information presented does not constitute financial, investment, trading, or other types of advice and is solely the writer’s opinion.
- DOT fronted a price reversal after a recent price dip to $3.6.
- Demand for DOT improved, but funding rates were negative.
Polkadot [DOT] extended its Q3 losses into Q4 2023, as its bearish pressure persisted. In October, DOT shed over 15%, dropping from $4.3 to $3.6. However, after Bitcoin [BTC] recovered recent losses, the altcoin fronted a price reversal.
Read Polkadot’s [DOT] Price Prediction 2023-24
Since mid-July, sellers have overwhelmed DOT’s market. AMBCrypto’s previous price analysis of the token inclined towards extra losses if the bearish pressure persisted.
But the mid-October reversal attempt at $3.6 could set DOT to aim at the overhead resistance hurdle.
The roadblock at the $4 psychological level
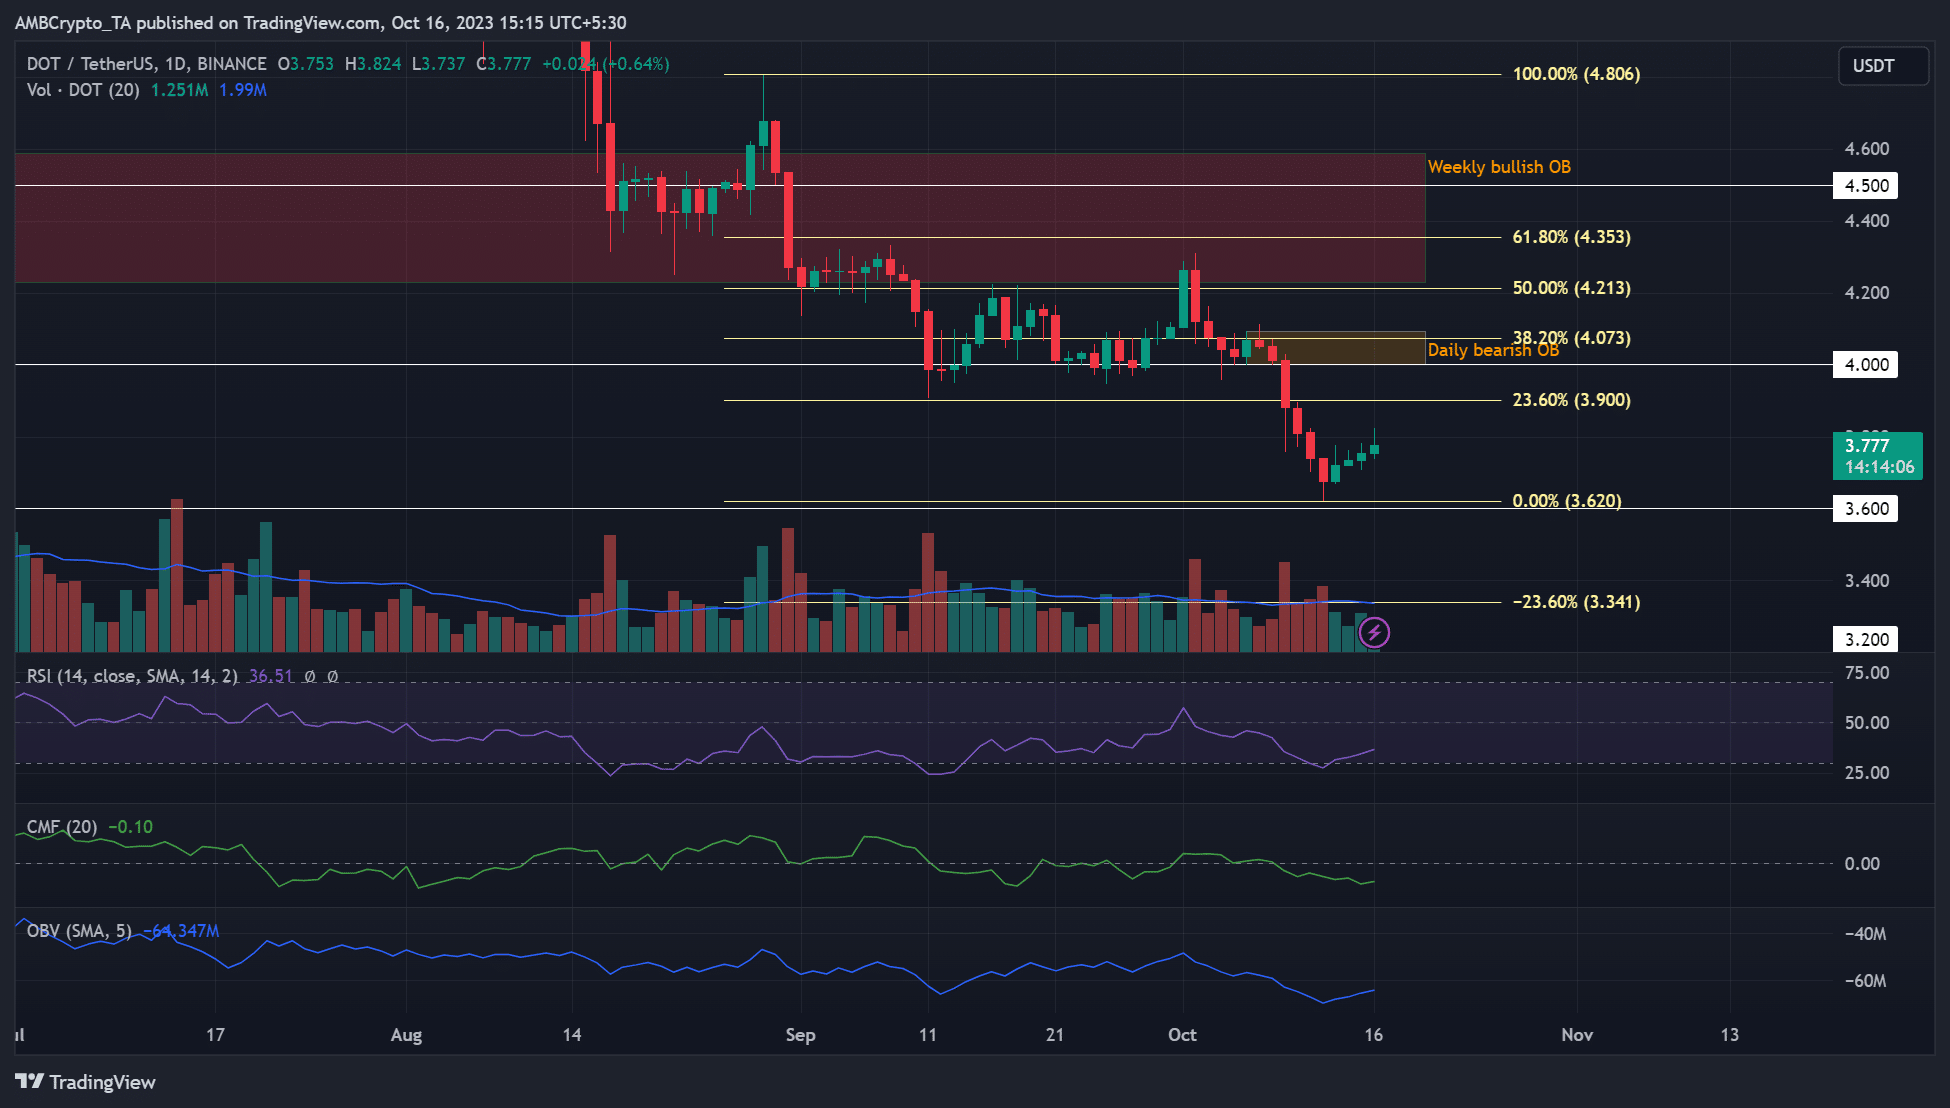
A Fibonacci retracement tool was plotted between the lower high of $4.8 on 29 August and the recent dip of $3.6 on 12 October. The Fib tool showed that the recent DOT reversal faced overhead obstacles at 23.6% Fib ($3.9) and 38.2% Fib ($4).
The second resistance target of $4 doubled as a daily bearish order block (OB). The confluence inferred that the level could present more challenges to bulls if DOT prices exceeded $3.9.
Meanwhile, the Spot market demand improved slightly, as shown by the uptick in OBV. Besides, the buying pressure recovered, as illustrated by the uptick in RSI, but remained below the 50-mark threshold to confirm a strong bullish reversal.
However, DOT recorded limited capital inflows, as demonstrated by the southward movement of CMF.
Demand recovered, but funding rates were negative
Since 8 October, DOT’s Open Interest (OI) rates improved from $156 million to $169 million at press time. It meant that demand for DOT in the derivatives segment recovered over the past few days.
How much are 1,10,100 DOTs worth today?
The reversal saw bulls regain a slight market edge, as indicated by the surge in CVD (Cumulative Volume Delta).
The two positive indicators are a bullish scenario for DOT. But the higher timeframe market structure bias was negative unless DOT surged beyond $4. And the negative funding rates could complicate the bullish efforts.


