- Solana’s symmetrical triangle pattern hints at a potential breakout, possibly pushing the price up to $220.
- Derivatives data shows a 51.5% surge in SOL trading volume, signaling heightened market activity and volatility.
Solana [SOL] was experiencing heightened market activity, with its price trading at around $140.97 at press time. Technical analysis points to a possible turning point for Solana, driven by key chart patterns and increasing interest in the derivatives market.
The price of SOL has dropped by 2.74% over the last 24 hours, with a 7-day decline of 2.54%, reflecting some bearish pressure in the market.
Despite the recent downward movement, analysts are observing a symmetrical triangle pattern, which could signal an upcoming breakout.
This pattern suggests that if Solana breaks above resistance, it could target as high as $220, representing a potential 53.28% increase from current levels.
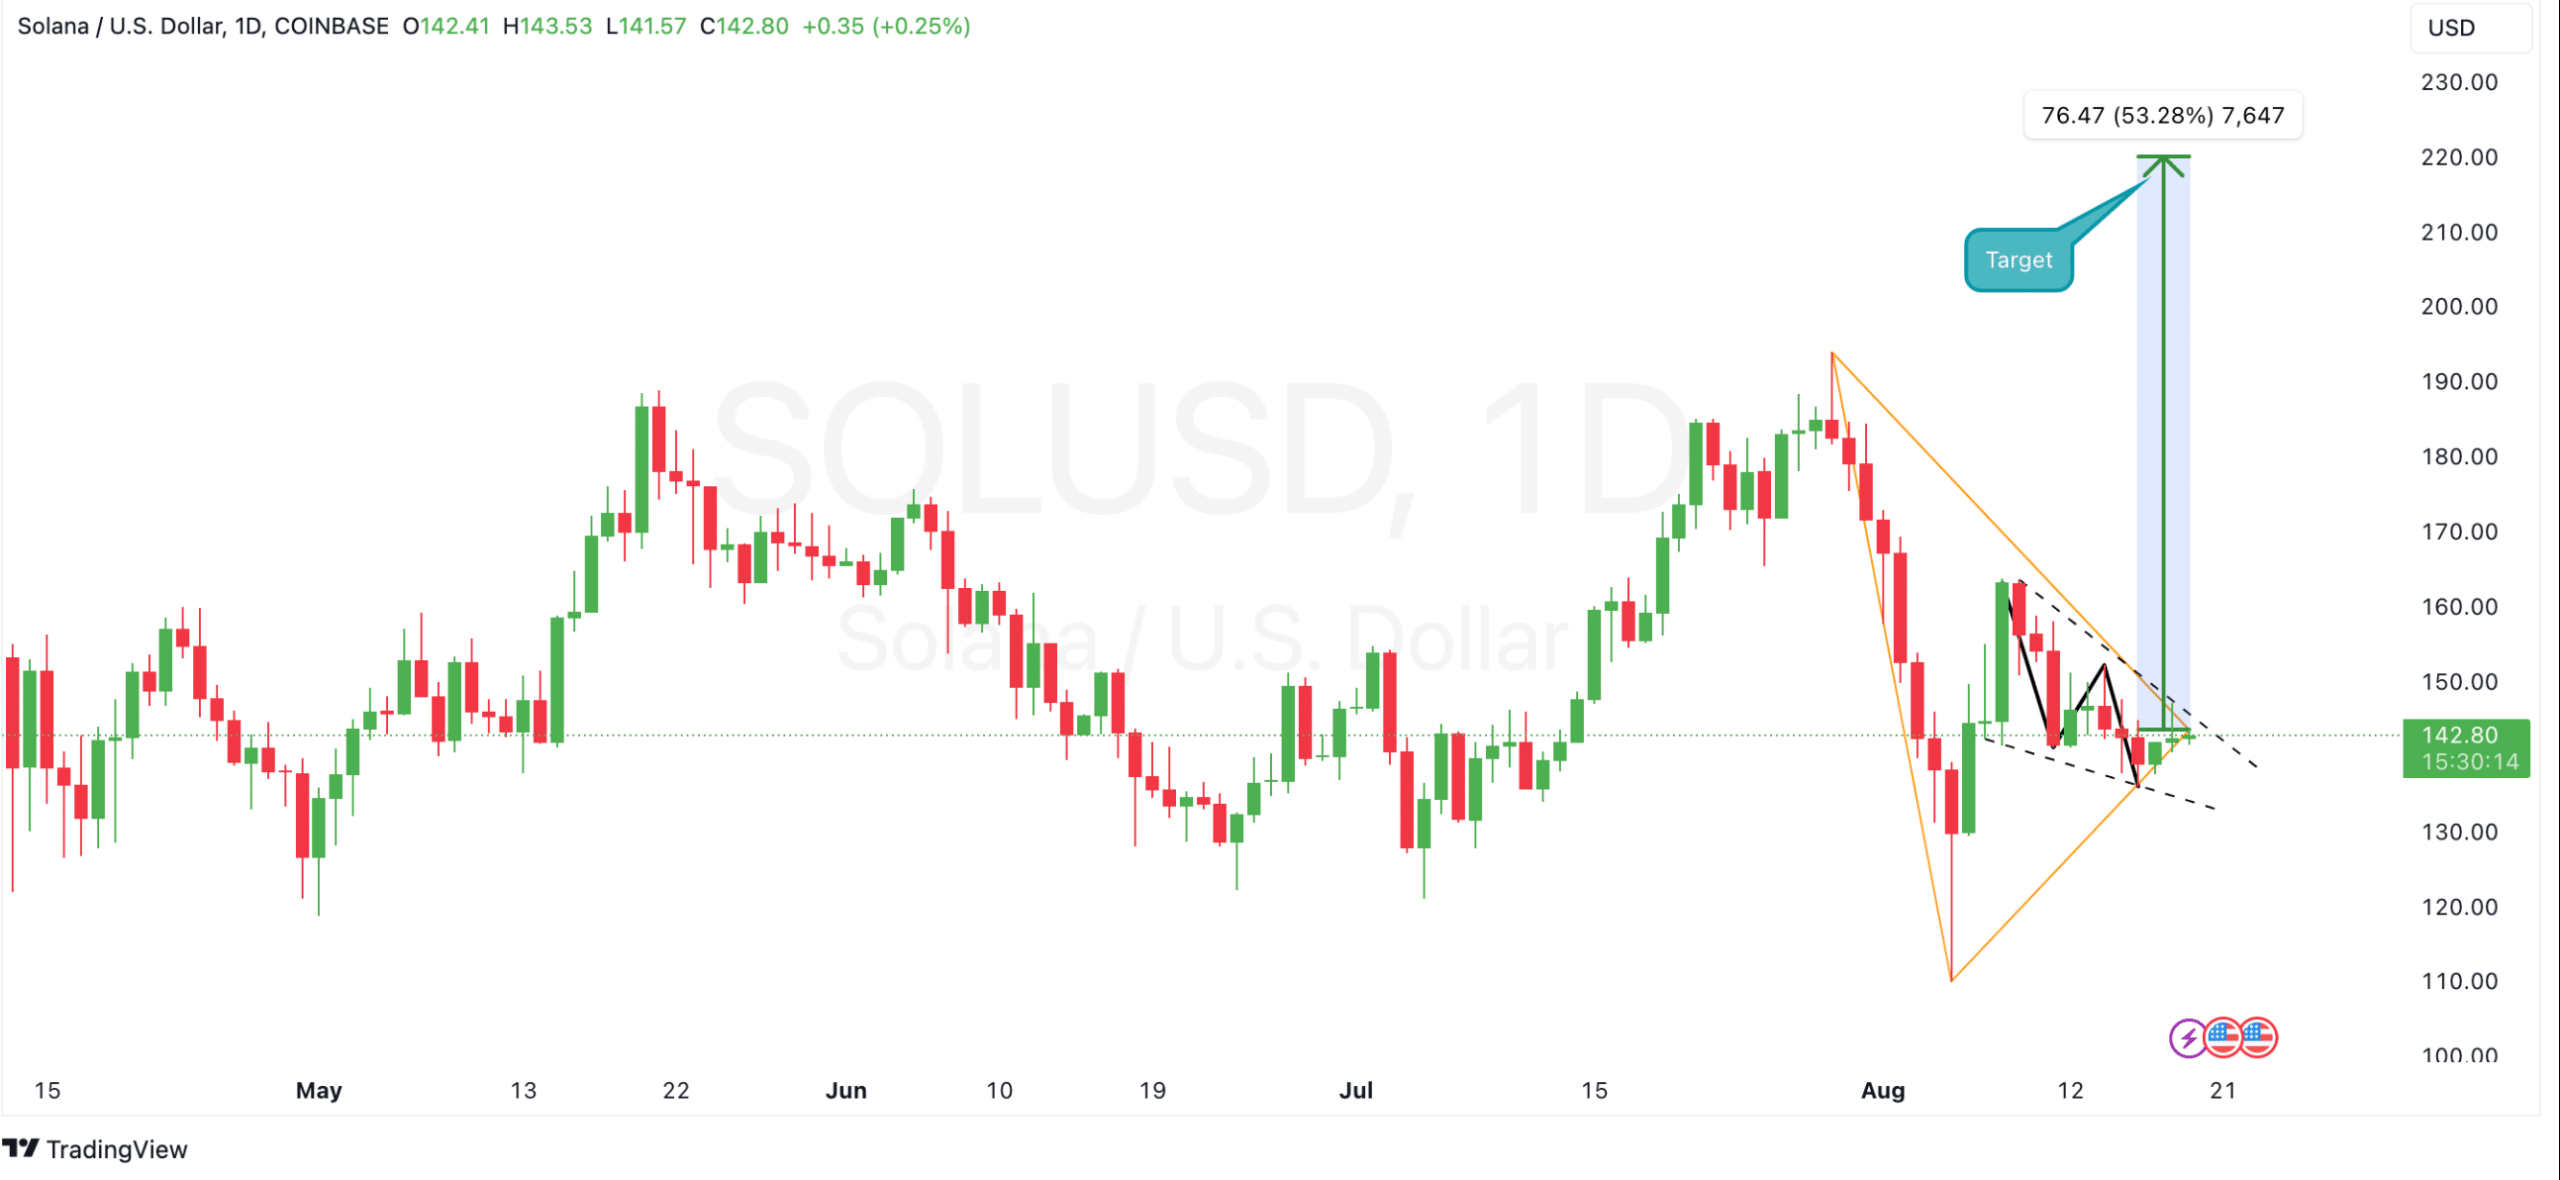
Source: TradingView
Traders are monitoring this potential breakout, looking for confirmation of an upward rally.
Technical indicators signal mixed market sentiment
SOL was trading near $140.76 at press time, below the middle Bollinger Band at $147.49. This suggests potential bearish pressure, with a possible trading range between $167.75 and $127.23 if volatility rises.
Traders may use this range to guide their short-term strategies as market conditions shift.
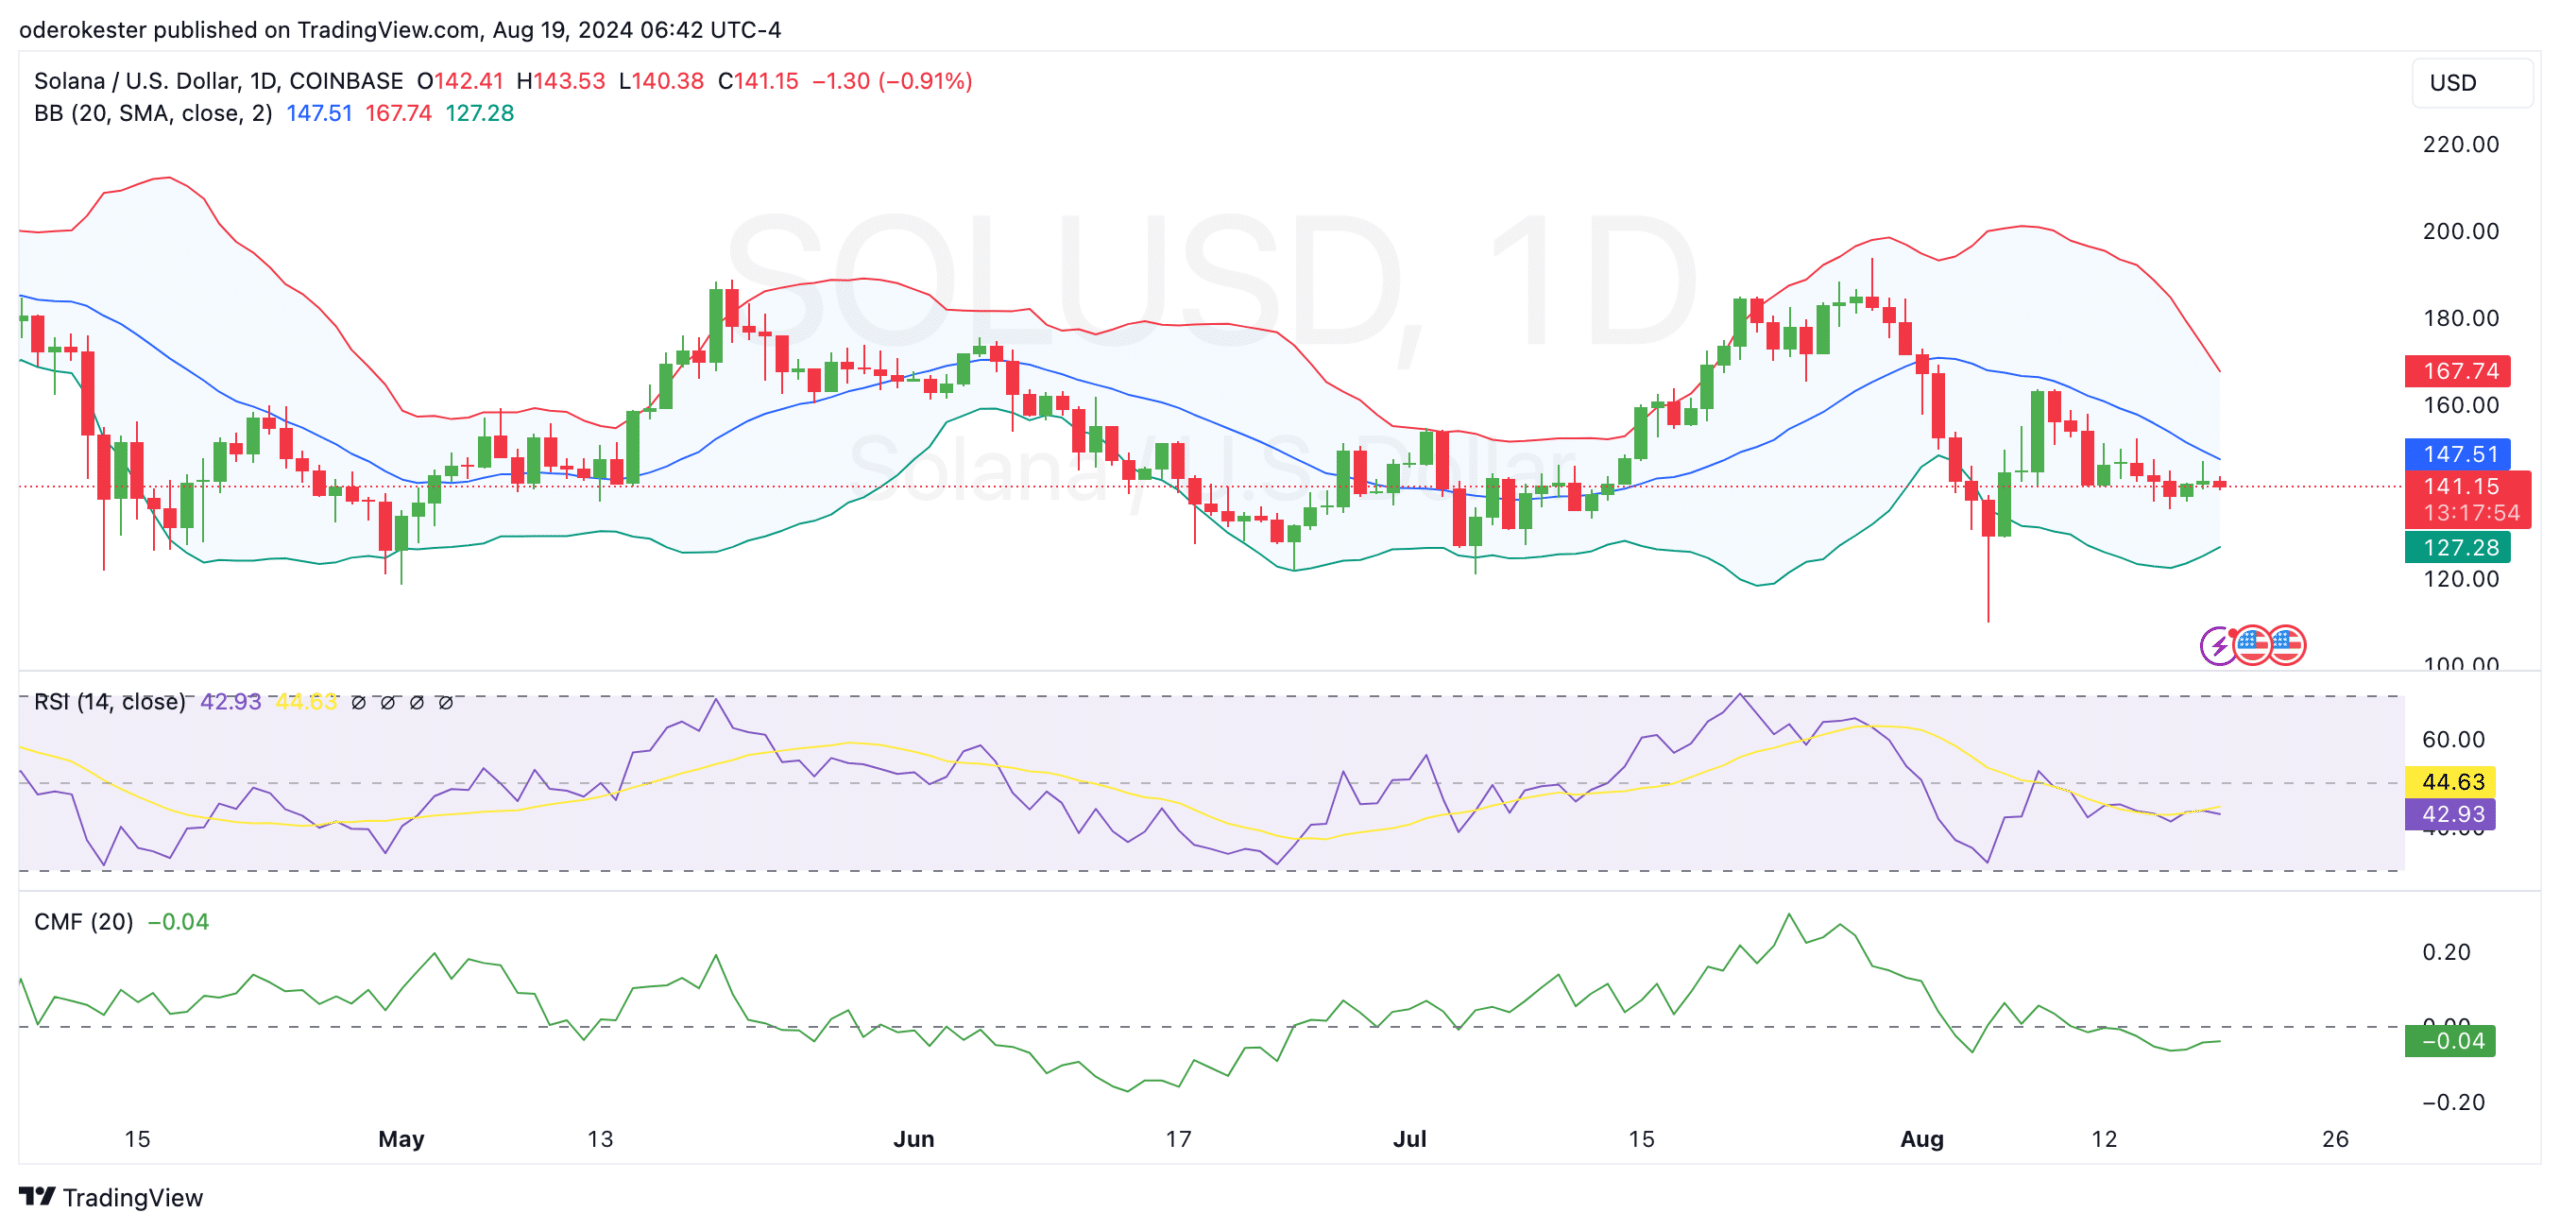
Source: TradingView
Meanwhile, the Relative Strength Index (RSI) is currently at 42.69, below the neutral 50 level, suggesting that momentum remains on the bearish side.
However, the RSI is not in the oversold territory, which means there is still room for further declines or a potential reversal if buying interest picks up.
The Chaikin Money Flow (CMF) also shows weak capital inflows, with a slightly negative reading of -0.04, further reinforcing the cautious sentiment among traders.
Solana’s trading surge signals volatility
Derivatives data for Solana reflects a notable increase in trading volume and open interest. Trading volume surged by 51.50% to $5.48 billion, while open interest increased by 3.74% to $2.03 billion.
This rise in activity suggests that traders are increasingly positioning themselves in the market, potentially anticipating large price moves. The options market also saw a rise in open interest, indicating growing speculative bets on SOL’s future price direction.
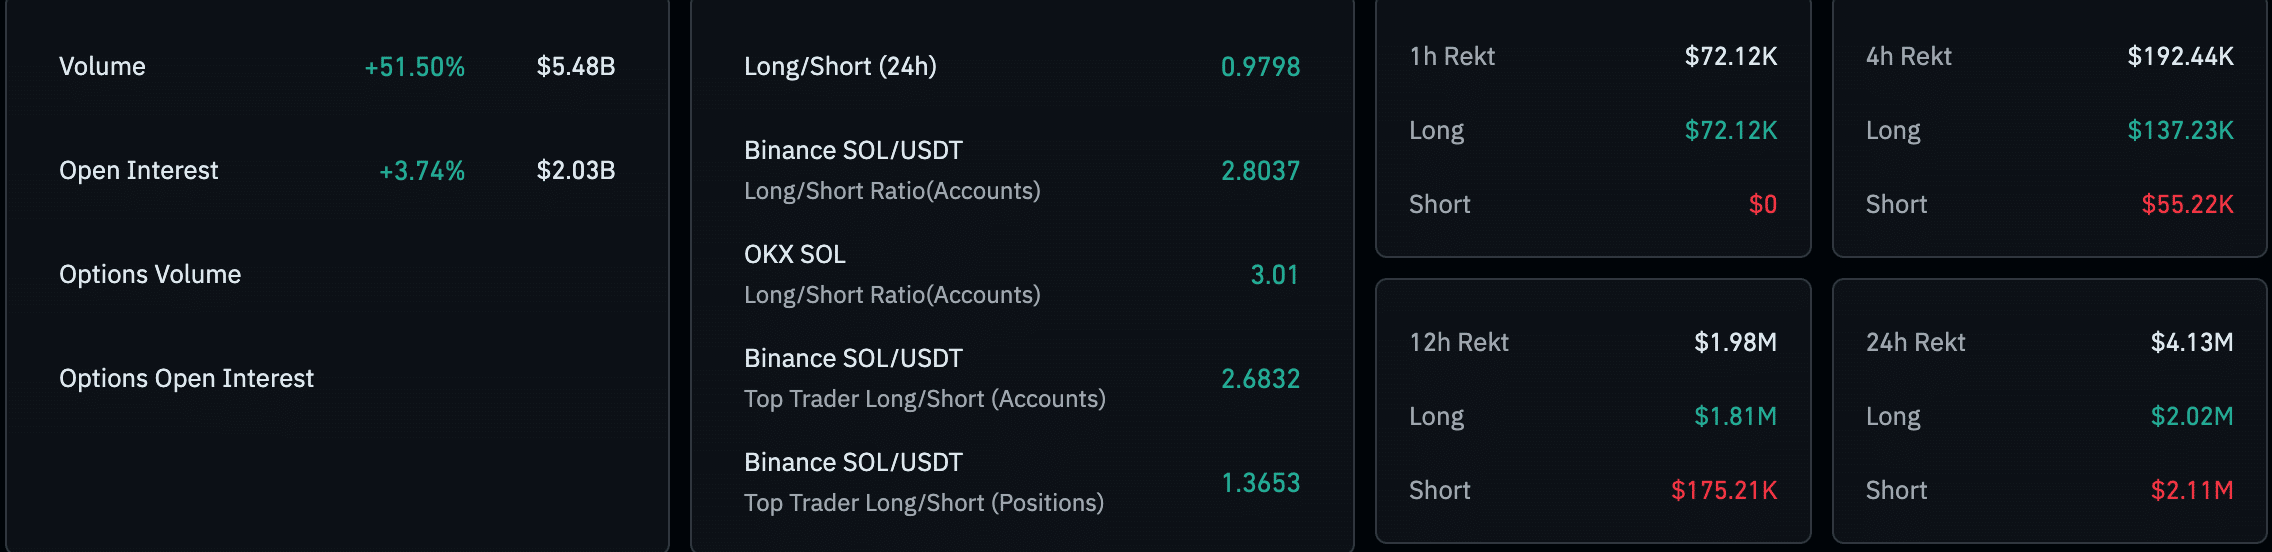
Source: Coinglass
Long/short ratios across major exchanges show mixed sentiment. On Binance, the long/short ratio remains close to neutral at 0.9798, indicating a balanced stance among traders.
On OKX, the ratio is more bullish at 3.01, reflecting stronger optimism in SOL’s future price potential.
Read Solana (SOL) Price Prediction 2024-25
However, data on liquidations shows that $4.13 million was liquidated in the past 24 hours, with losses nearly evenly split between long and short positions, underlining the current market volatility.
Solana’s recent price movements and increased trading activity suggest that the asset is at a critical juncture.