Can Solana hold $60? Major signs point to extended losses in August
SOL's price structure and the failure to push above $80 signal short-term seller dominance.



Since the 9th of July, Solana [SOL] bulls tried repeatedly to drive a price move beyond the $80 round-number supply zone. They met with little success.
Steady network usage and growing stablecoin liquidity pointed to a resilient ecosystem, but not necessarily a price recovery.
The constructive signal from on-chain metrics was met by bearish price action since April 2025. Even the rally towards the end of the year that reached $253 was only a retracement phase, well before Bitcoin [BTC] entered its bear market.
Here’s a thorough breakdown of the long-term trends and what traders and investors can expect from SOL in August.
Bitcoin ATHs came when Solana was already in a bearish trend
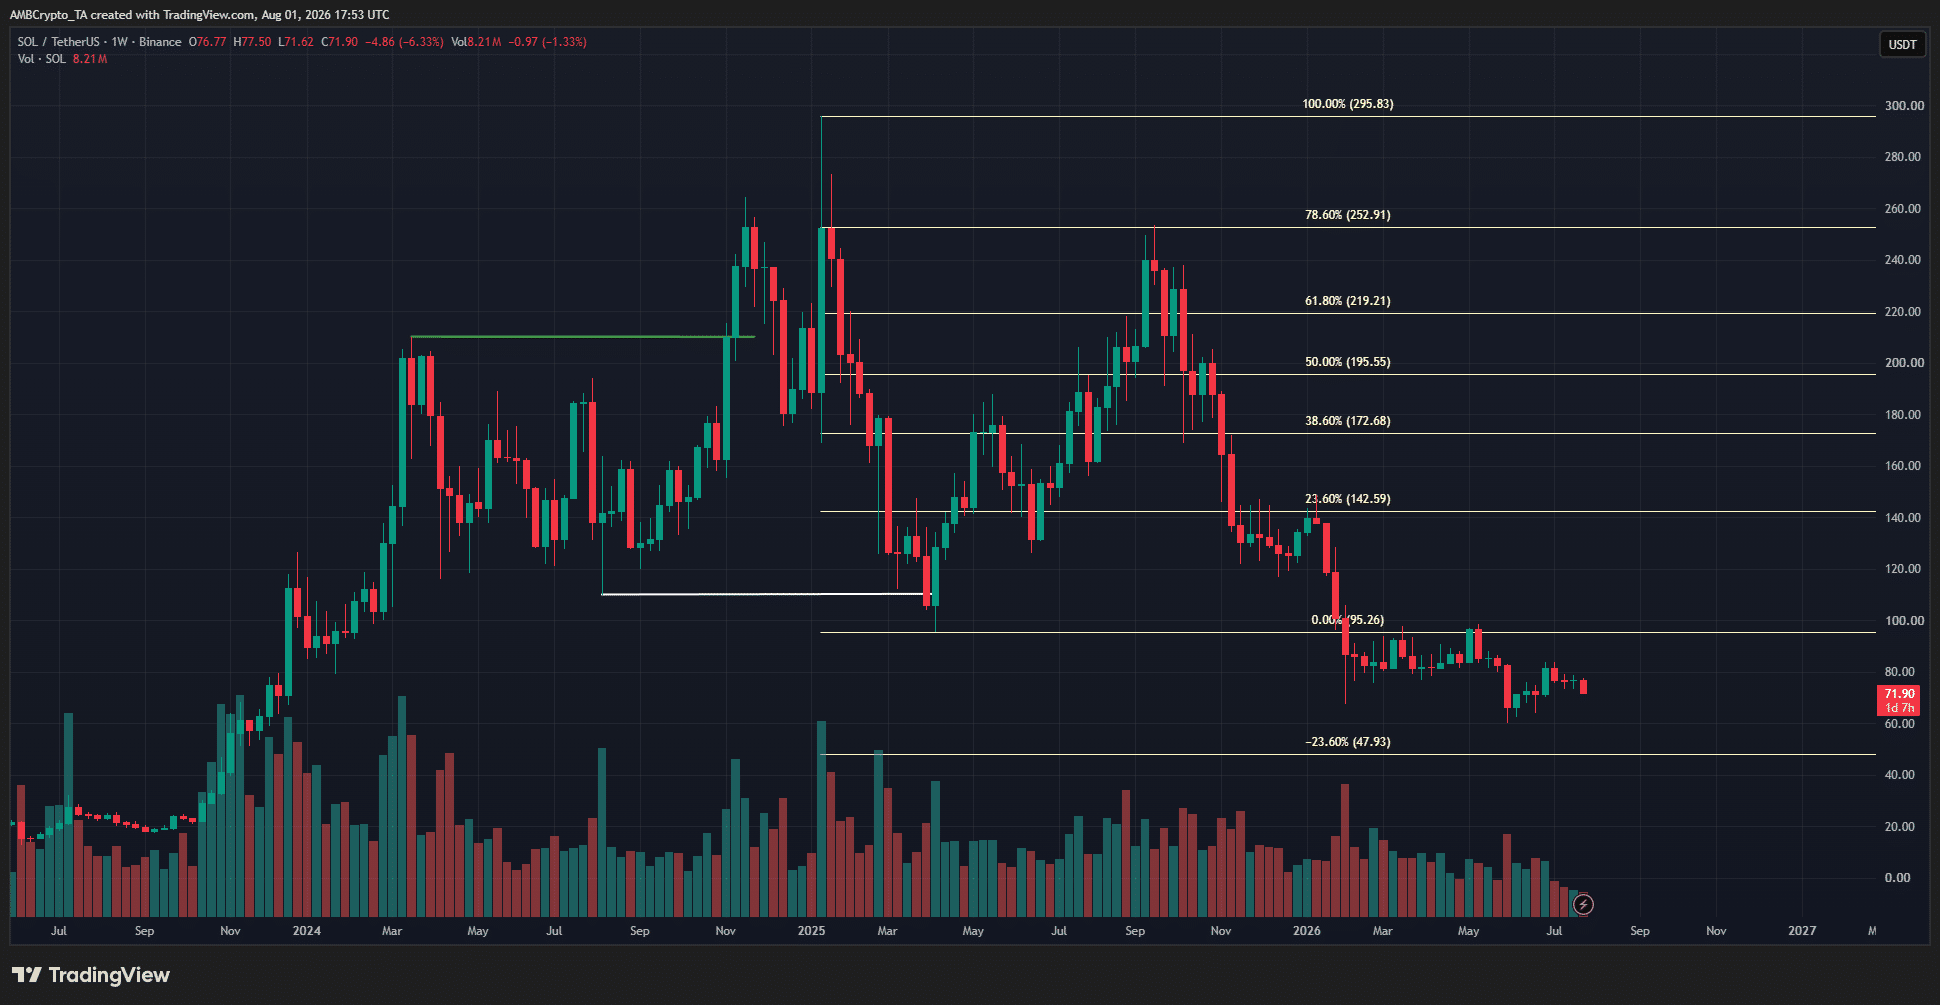
Solana was trending higher in 2024. The move beyond the $210 swing high (green) in November 2024 signaled a bullish continuation. It originated from the $110 (white) swing low.
When this swing low was breached in March 2025, it signaled a swing structure break on the weekly timeframe. Within this bearish trend, a rally to the 78.6% Fibonacci retracement level at $252.9 came later in 2025, when Bitcoin was making new all-time highs.
Seen through these lenses, the drawdown since September made perfect sense. The Fibonacci extension level at $47.9 also forecasted a potential bear market price target for SOL.
The August expectations for Solana
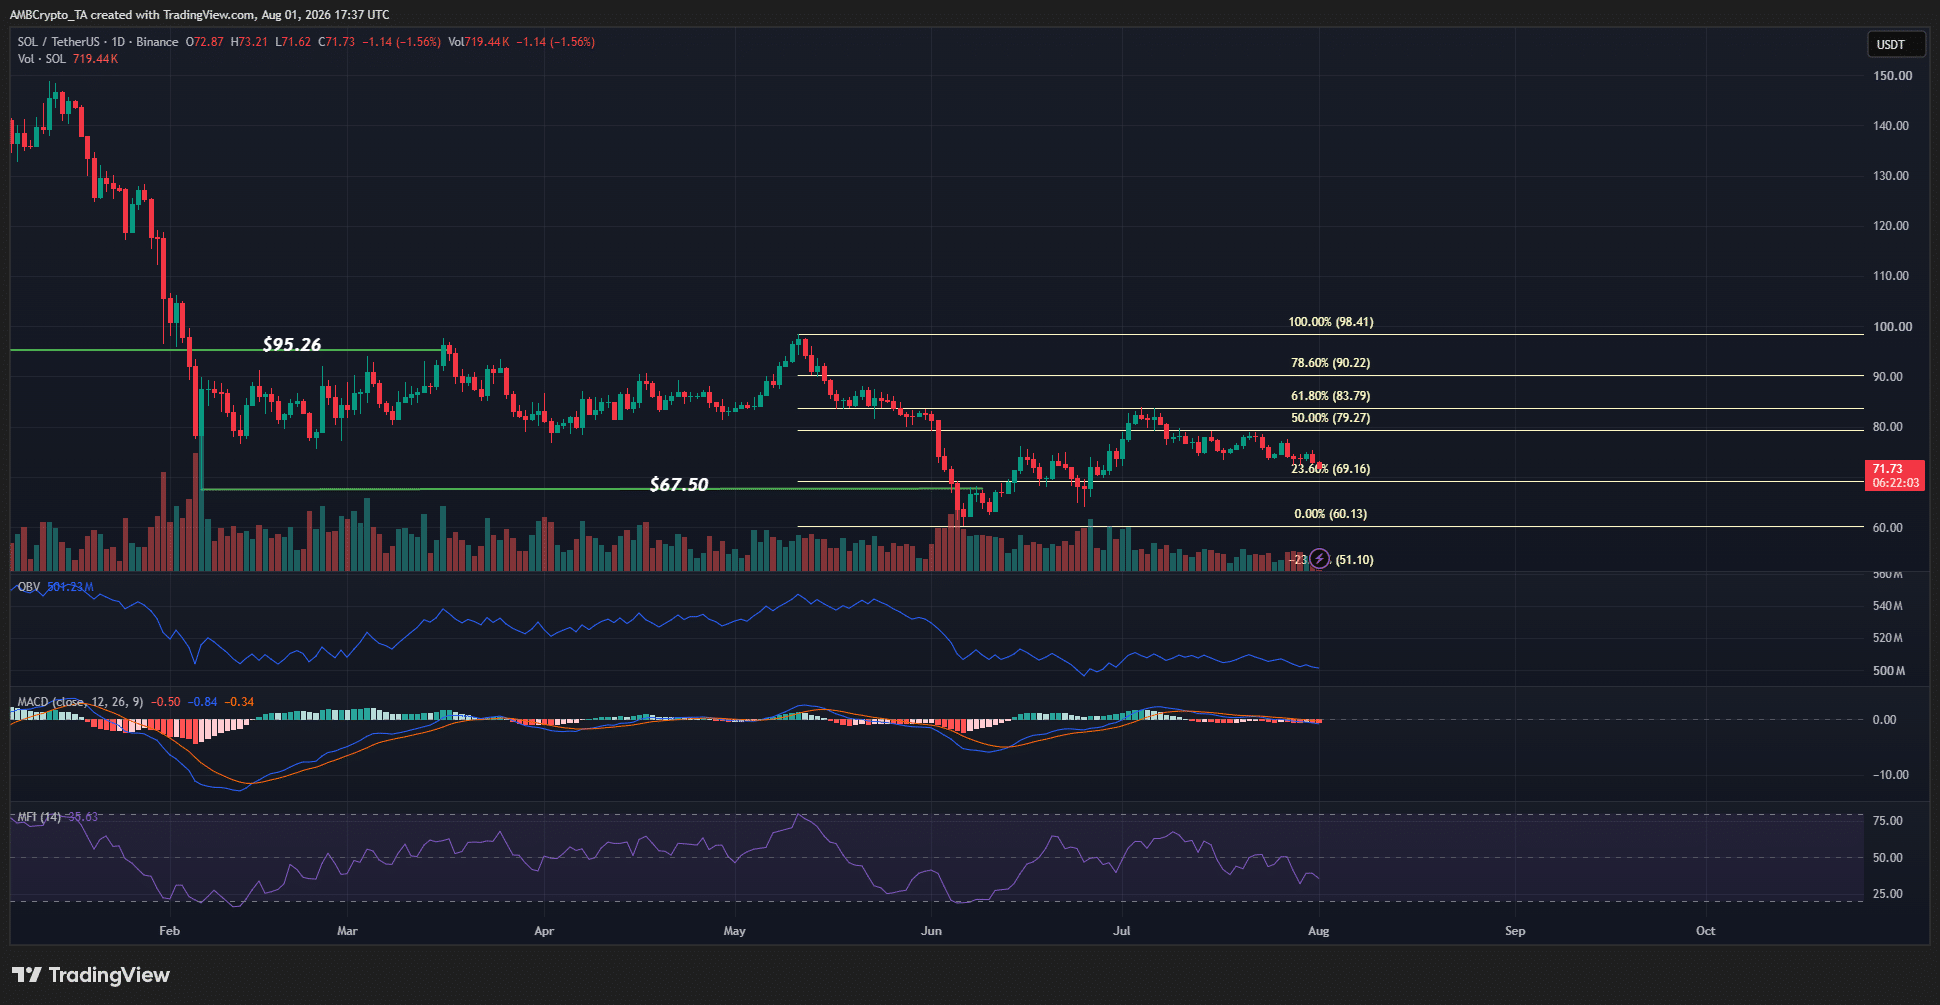
The 1-day timeframe was also bearish. The RSI was below neutral 50, and the MACD has made a bearish crossover below the zero line. The momentum indicators agreed upon further downside potential.
So did the price action. After facing rejection from the 61.8% retracement level at $83.8, SOL has suffered steady losses throughout July.
Over the past week, the price tested the $73.4 local support zone before falling below it on Friday, the 31st of July. This meant that the short-term expectations are also bearish.
The next price targets in August are $64.1 and $60.1. Popular crypto analyst Ali Martinez also came to the same conclusion after the altcoin lost a channel support.
If a heavy Bitcoin sell-off occurs, it is likely that Solana prices would drop towards or lower than $50.
Final Summary
- The constructive signal from on-chain metrics has been facing the reality of bearish price action recently.
- In the coming weeks, a price drop toward $60 can be expected.