Can Solana surge to $299 soon? What the data suggests
After reaching an all-time high, where could SOL go next? Let’s find out.

- Solana’s bullish pennant pattern hinted that SOL could reach the $299 level following the breakout.
- Traders were over-leveraged at $251.2 on the lower side and $264.1 on the upper side.
Solana [SOL], the world’s fourth-largest cryptocurrency by market capitalization, is poised for a notable upside rally as it forms a bullish price action pattern.
In recent days, alongside major cryptocurrencies, SOL reached its all-time high (ATH). However, its price now appears to be consolidating near that level.
This price consolidation near its ATH hinted at potential preparation for a further upside rally.
As of press time, SOL was getting support from its bullish price action, current market sentiment, and heightened participation from traders as well as investors.
Solana price action and key level
According to AMBCrypto’s technical analysis, SOL has formed a bullish pennant pattern on the four-hour time frame and is currently on the verge of a breakout.
Based on recent price action and historical price momentum, this bullish pattern has emerged near a strong resistance level of $260.
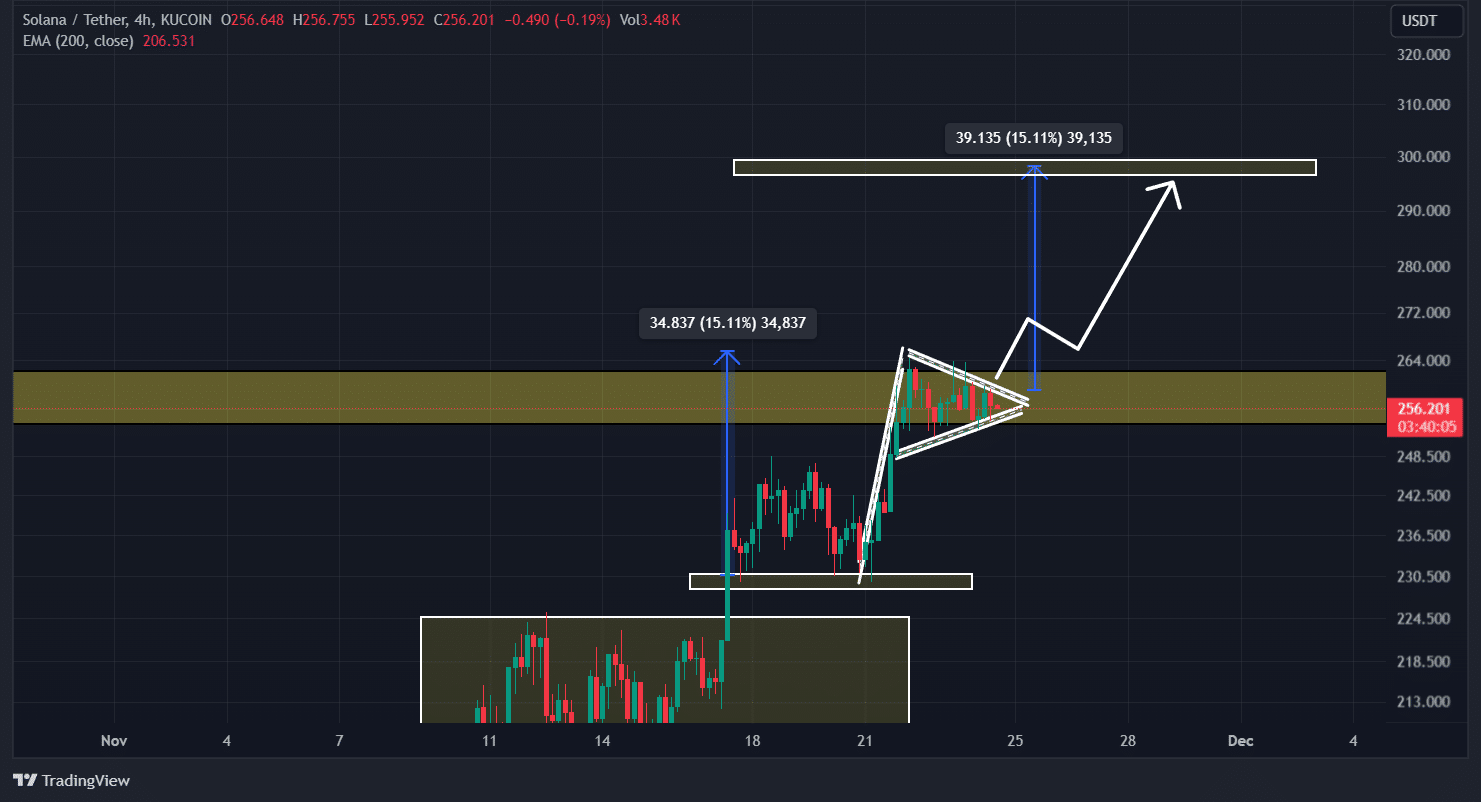
If SOL breaks out of this bullish pennant pattern, surpassing the resistance and closing a four-hour candle above the $260 level, there is a strong possibility it could rally by 15% to reach $299 in the coming days.
As of now, the asset was trading above the 200 Exponential Moving Average (EMA), indicating an uptrend. Traders and investors often rely on this indicator before building positions.
Additionally, its Relative Strength Index (RSI) was at 57.10, suggesting that SOL still has room to rally in the coming days.
Mixed sentiment from on-chain metrics
In addition to technical analysis, on-chain metrics suggest mixed sentiment among traders.
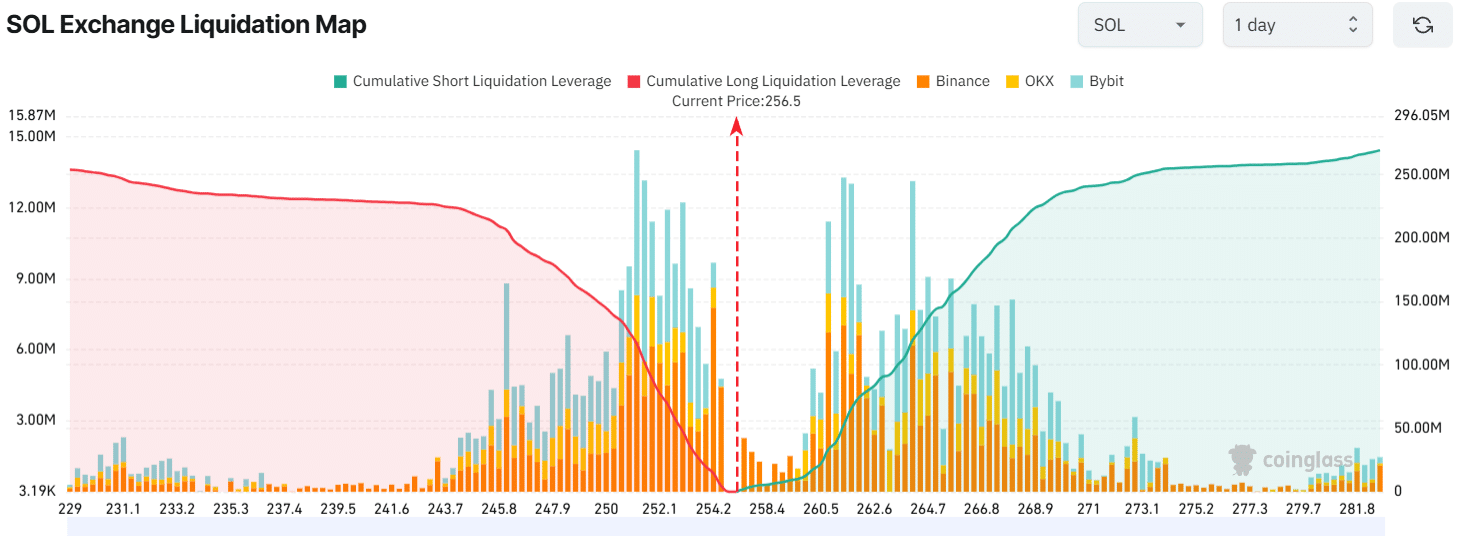
According to the on-chain analytics firm Coinglass, SOL’s Open Interest has decreased by 3.5%, indicating that traders have either exited their positions or faced liquidations during the price correction.
However, a breakout from the current price action pattern could attract both investors and traders.
Is your portfolio green? Check out the SOL Profit Calculator
At present, the major liquidation levels are at $251.2 on the lower side and $264.1 on the upper side, according to Coinglass’s exchange liquidation map.
This data indicates that traders are highly leveraged at these levels. A breakout or breakdown from these levels could provide a safer entry point for traders.