
Bitcoin breaks $120K after Trump’s ‘biggest deal ever!’
- XRP entered into a relatively high liquidity zone as its recent bull run consolidated.
- Altcoin’s long/short ratio on top exchanges showed a slight bullish edge.
Bulls finally succeeded in reclaiming a spot above the 20, 50, and 200-day EMAs after provoking a streak of green candles in early July.
In the meantime, XRP climbed above the crucial $0.57 support level after registering an over 46% ROI over the past three weeks.
With the price action now hovering near a relatively high liquidity zone, XRP could see a consolidation phase before likely continuing its uptrend. At press time, XRP traded at $0.61.
XRP jumps above EMAs to show bullish edge
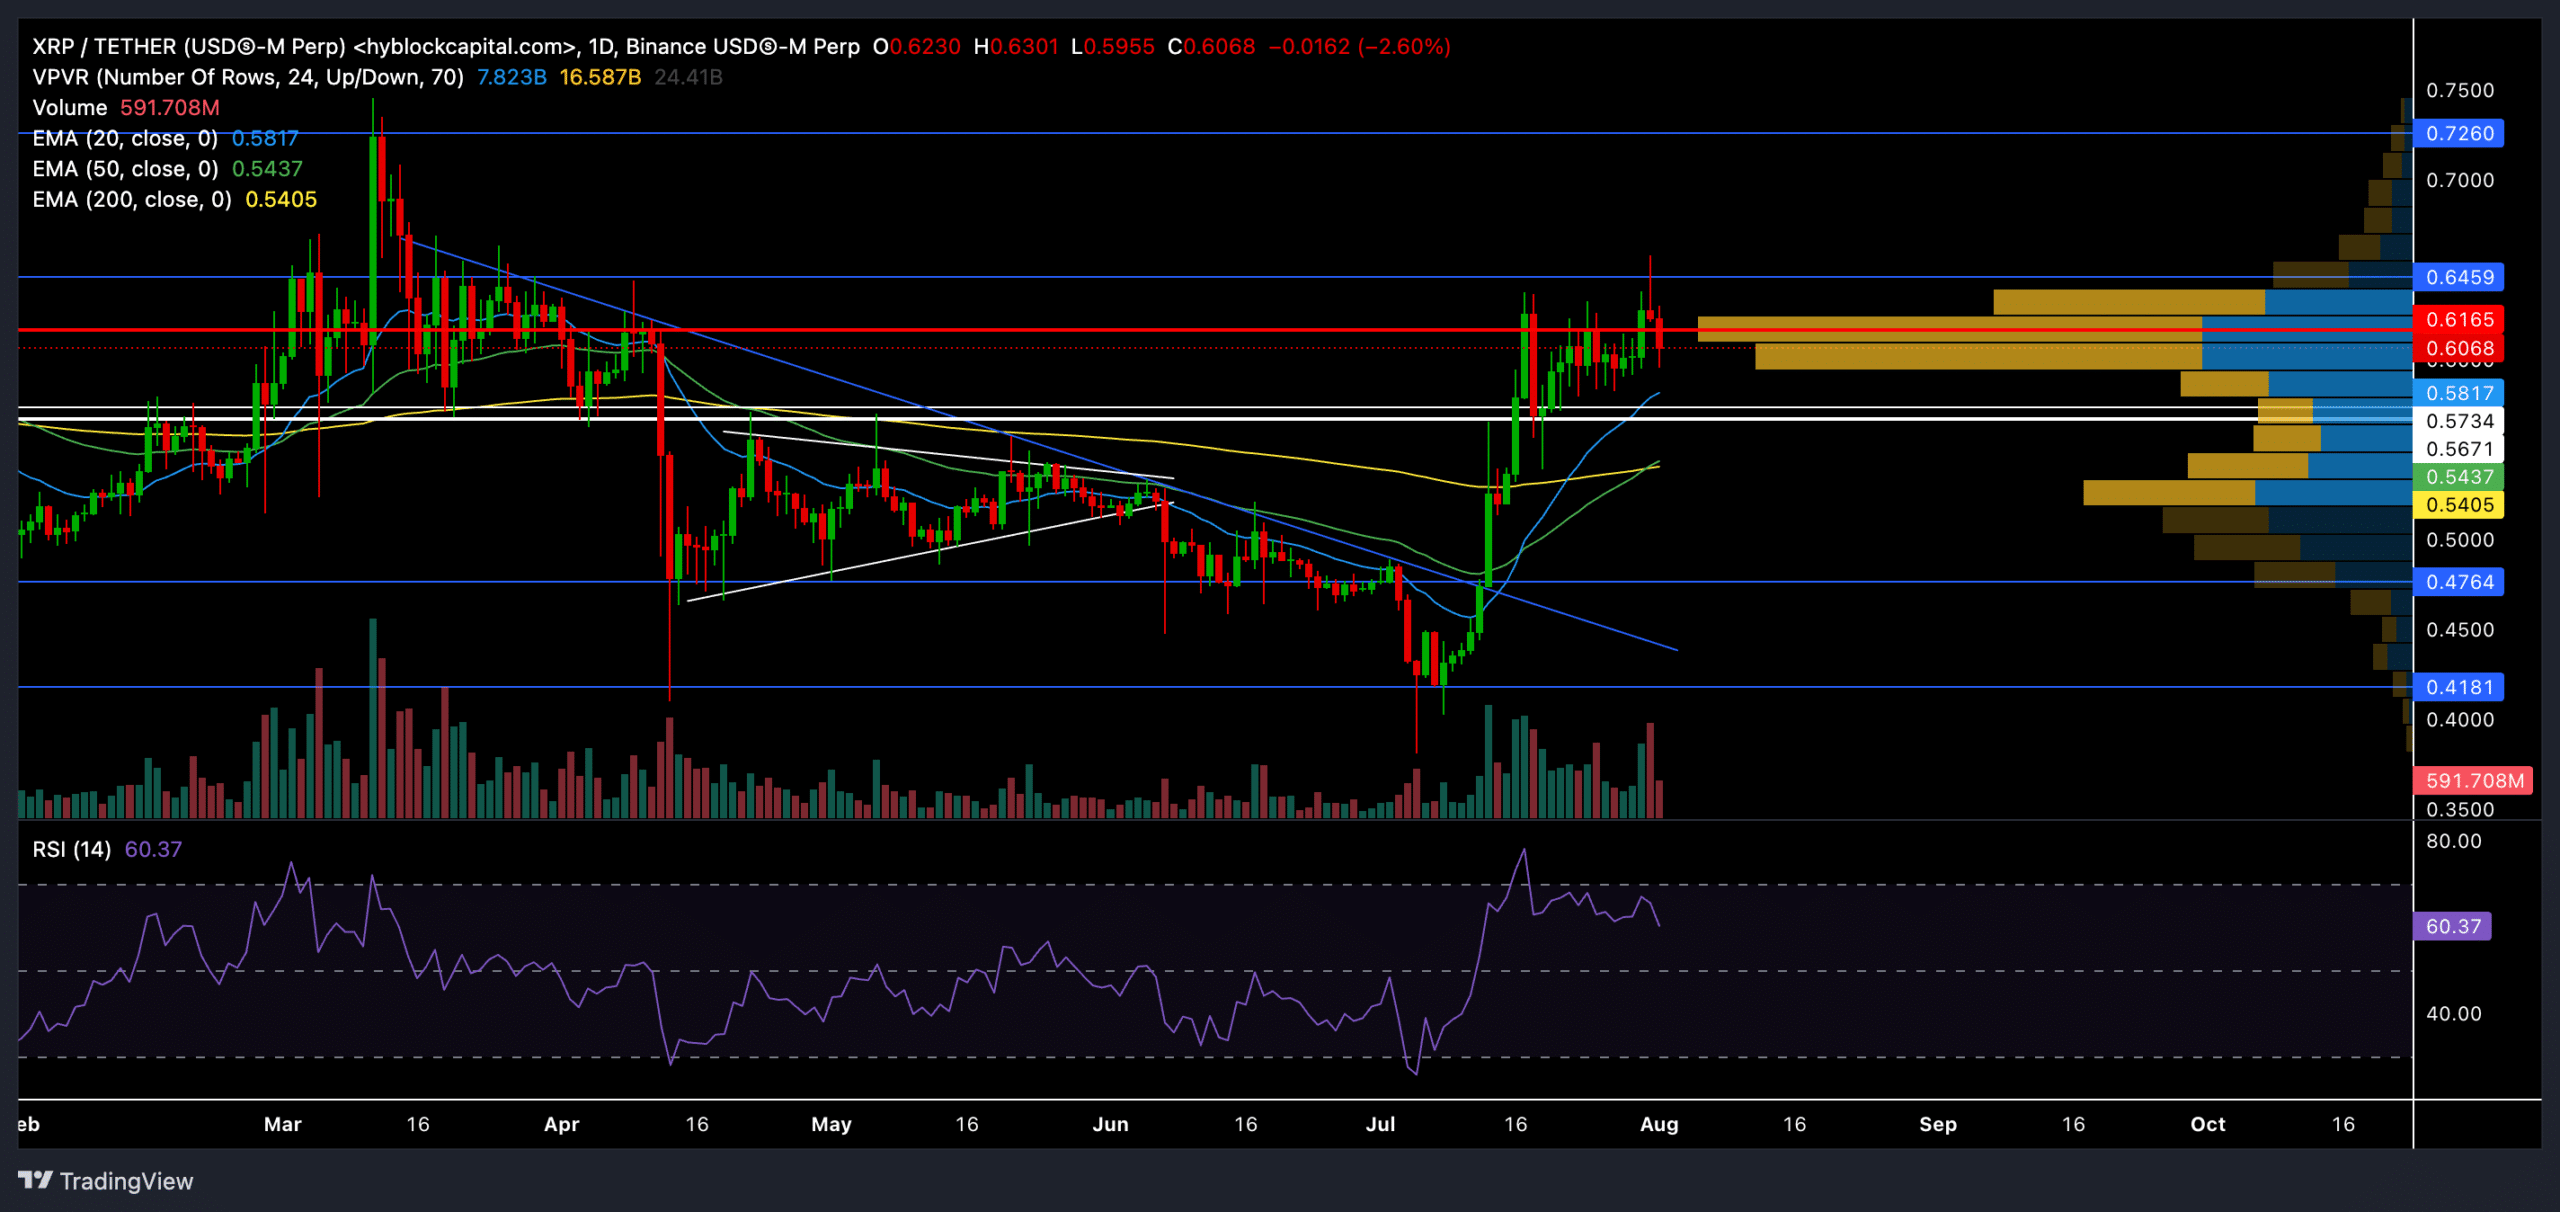
Source: TradingView, XRP/USDT
XRP was in a rather long-term downtrend after reversing from the $0.72 resistance in March 2024. The bears stepped in to induce a bearish rally, and XRP lost over 40% of its value in the next three months.
It also fell below the crucial 200-day EMA to confirm a strong bearish edge. But the tides turned after the bulls re-entered the market at the $0.41 support level.
This set the stage for the buyers to reclaim a spot above the 20, 50, and 200-day EMA as altcoin recovered its previous losses in a month-long rally.
However, the price action had now reached near the VRVP indicator’s Point of Control (POC, red). This level usually represents a level with the highest trading volumes over a specific time.
Thus, buyers would likely face immediate resistance near the $0.61-$0.64 range.
Now that the 50 EMA recently crossed above the 200 EMA, buyers could continue to exert more pressure in the coming weeks. Any close above the $0.64 resistance can set the stage for buyers to test the $0.73 resistance.
Any immediate decline will likely find support at the $0.57 support or near the 20 EMA.
The Relative Strength Index (RSI) saw a slight downtrend after reversing from the overbought territory at the time of writing.
The indicator will likely retrace toward the 50-mark as the buying pressure eases in the near term before a bullish reversal.
Derivates data reveals THIS

Source: Coinglass
Read Ripple’s [XRP] Price Prediction 2024-25
Despite the 6% price drop over the past day, the data showed a somewhat bullish sentiment in the derivatives market— with more longs than shorts on major exchanges and higher liquidations for short positions.
This could suggest that traders are anticipating a potential reversal or are positioned defensively against further downside.


