
7 companies rush to launch XRP ETFs: Analyst hails ‘good sign’
- XRP recovered by over 45% in the past ten days after jumping from its $0.41 support.
- The altcoin’s derivates data showed a slight bullish edge for the long term.
The buying efforts to reclaim crucial support levels on the charts finally provoked a steep bull run as XRP breached above the 200-day EMA after an extended downtrend amid market uncertainty.
Over the past week, XRP bulls managed to break above the long-term trendline resistance and flip it into support.
A sustained bullish crossover of the 20-day and 50-day EMA can set the stage for the buyers to provoke a long-term uptrend in the coming weeks. At the time of writing, XRP traded at $0.61 and was up by nearly 9% over the last day.
XRP reclaimed crucial support levels, can it continue rising?
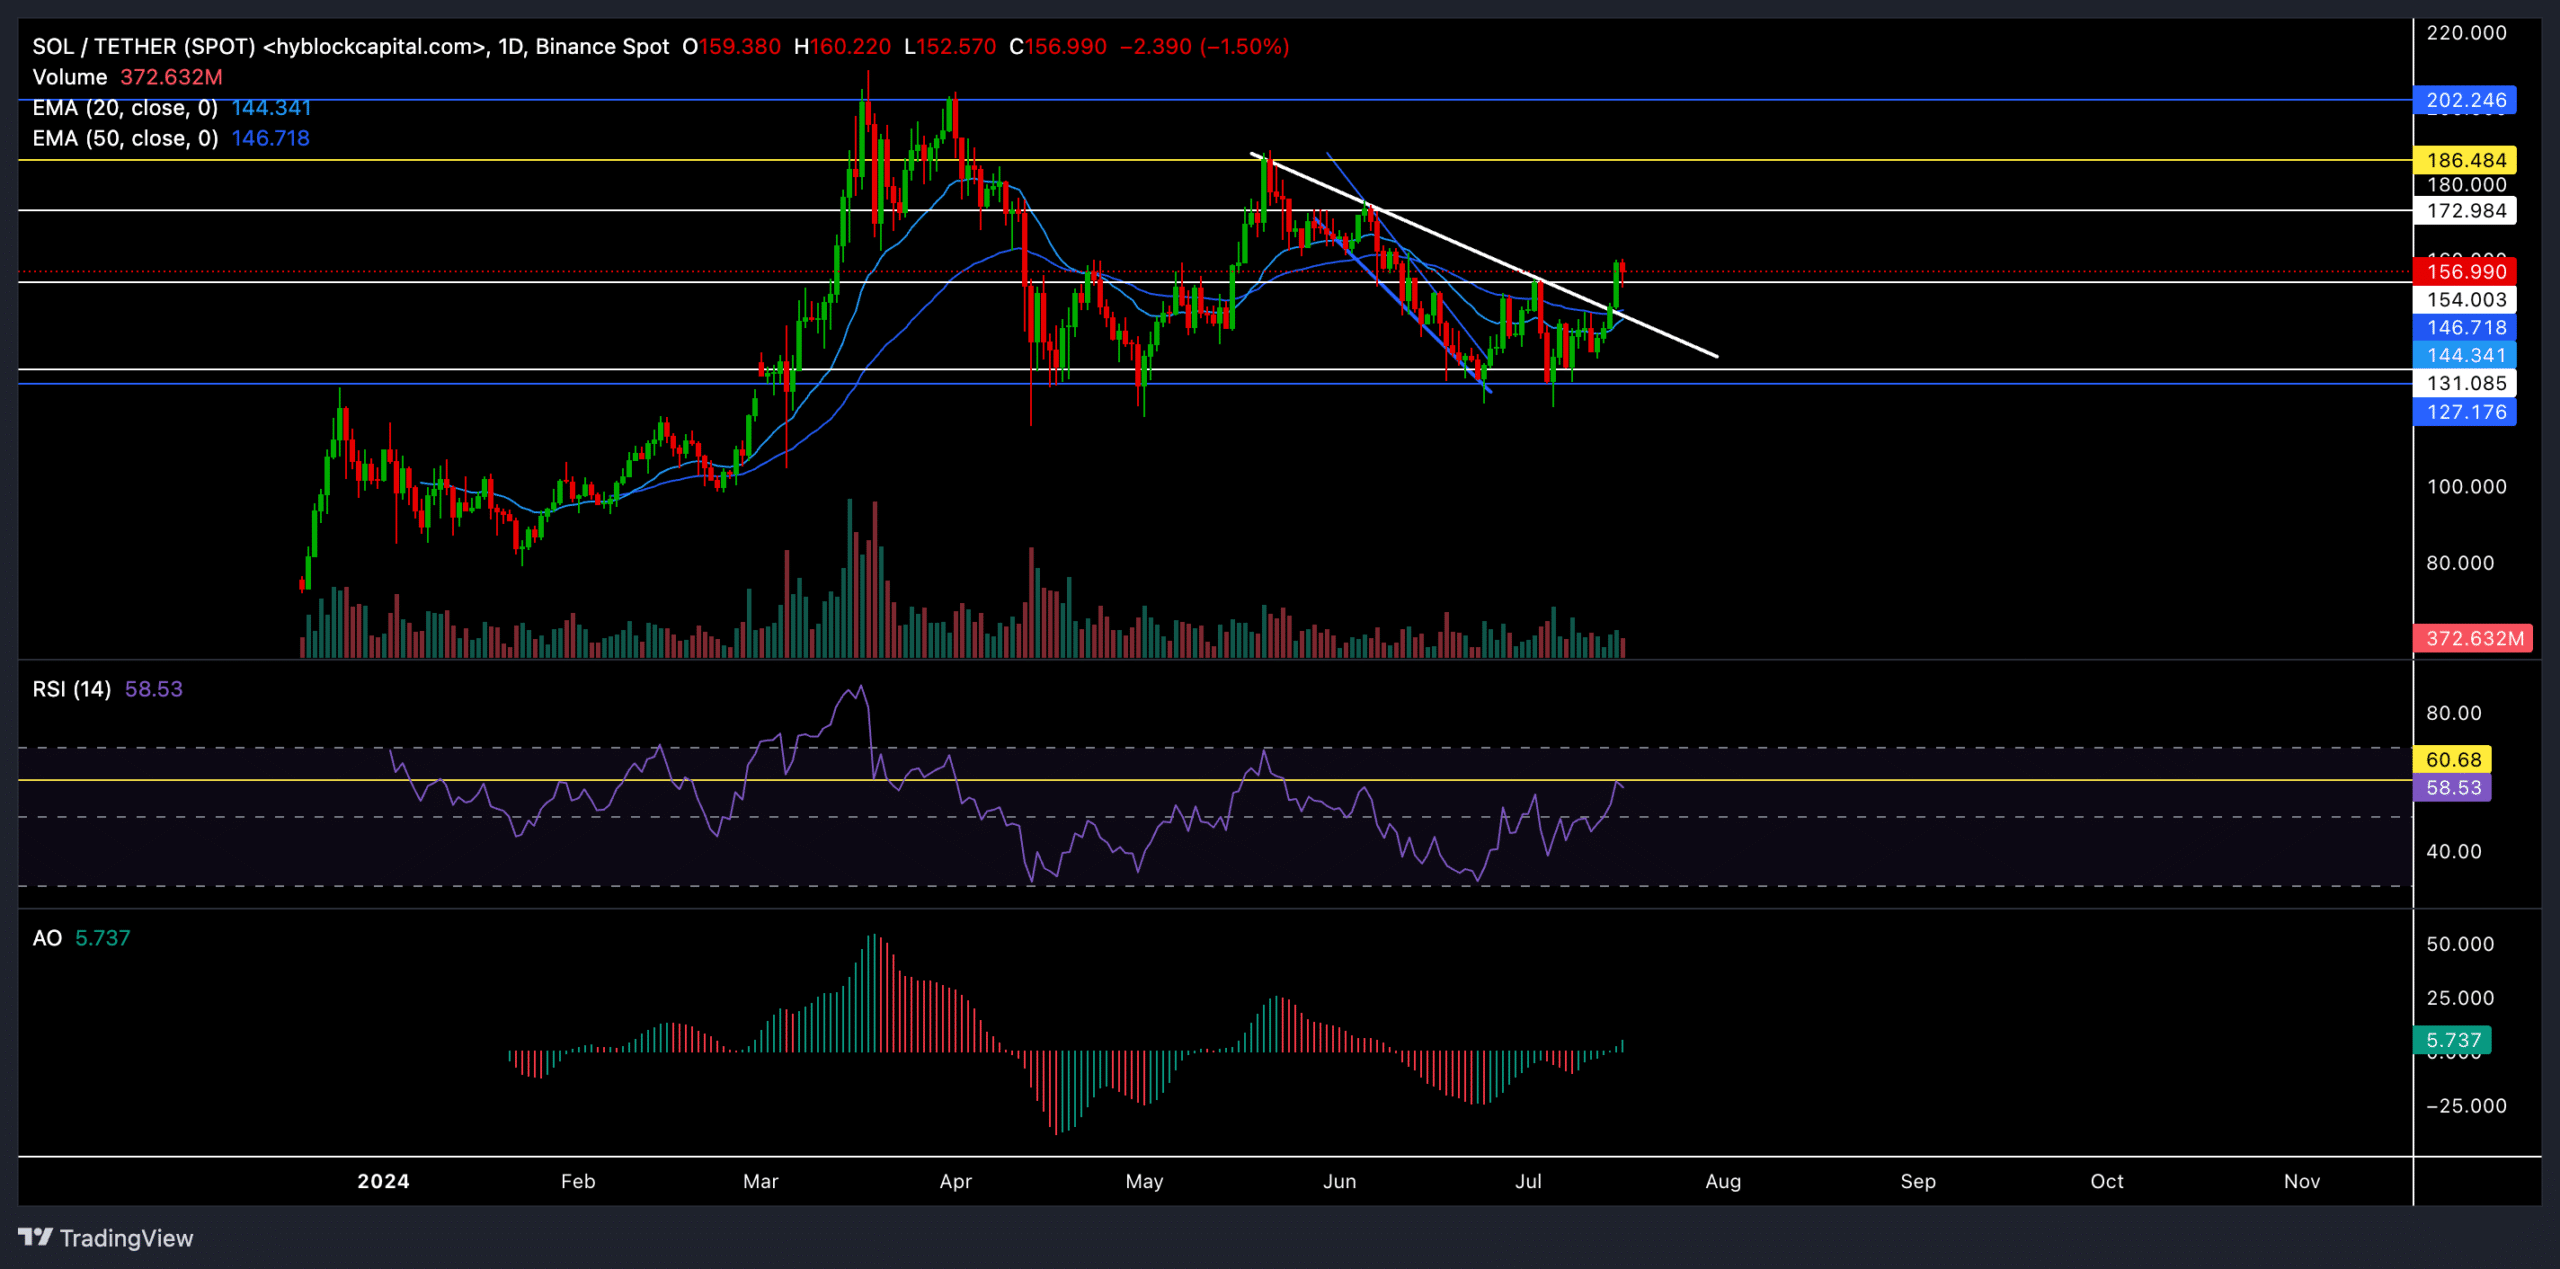
Source: TradingView, XRP/USDT
After witnessing a rather steep downtrend for nearly four months, XRP’s recent movements have reignited some revival hopes. During this downtrend, the altcoin lost nearly 42% of its value.
However, the $0.41 level has been acting as a strong support for over a year. As a result, XRP rebounded from this level while the broader market sentiment improved.
This set the stage for XRP bulls to reclaim important support levels, as they found a rally above the 20, 50, and 200-day EMAs. XRP’s recovery propelled a gain of nearly 45% in just the last ten days.
In the meantime, the price action had reached near the POC line (red) of the Visible Profile Volume Range. This line typically depicts a price point with the highest trading volumes.
As a result, this line could also act as an immediate resistance level. Any reversals from this level would likely find support near the $0.57 level. Any decline below this support can delay the immediate recovery prospects.
Should the near-term EMAs cross the 200-day EMA, it could set the stage for bulls to continue the recent uptrend. In this case, buyers would look to test the $0.72 resistance.
The Relative Strength Index (RSI) saw a steep uptrend and was near the overbought territory at press time. After some fluctuation around this level, it would likely retrace toward the 50-mark as the buying pressure eases.
Derivates data revealed this

Source: Coinglass
It’s worth noting that the overall long/short ratio (24h) is 0.9448— suggesting a slight bearish tilt. However, the long positions outnumber shorts on specific exchanges like Binance and OKX.
Read Ripple (XRP) Price Prediction 2024-25
On the other hand, while the options volume is down 46.56%, the options open interest is up 15.02%. This suggested a longer-term positioning in the options market.
Derivates data suggested increased trading activity and interest in XRP, with mixed signals between short-term trading (more bearish) and longer-term positioning (more bullish).


