Analysis
Capitalize on Tron’s [TRX] breakout rally by doing this
![Capitalize on Tron’s [TRX] breakout rally by doing this](https://ambcrypto.com/wp-content/uploads/2022/08/Untitled-design-16-1000x600.png)
Disclaimer: The findings of the following analysis are the sole opinions of the writer and should not be considered investment advice
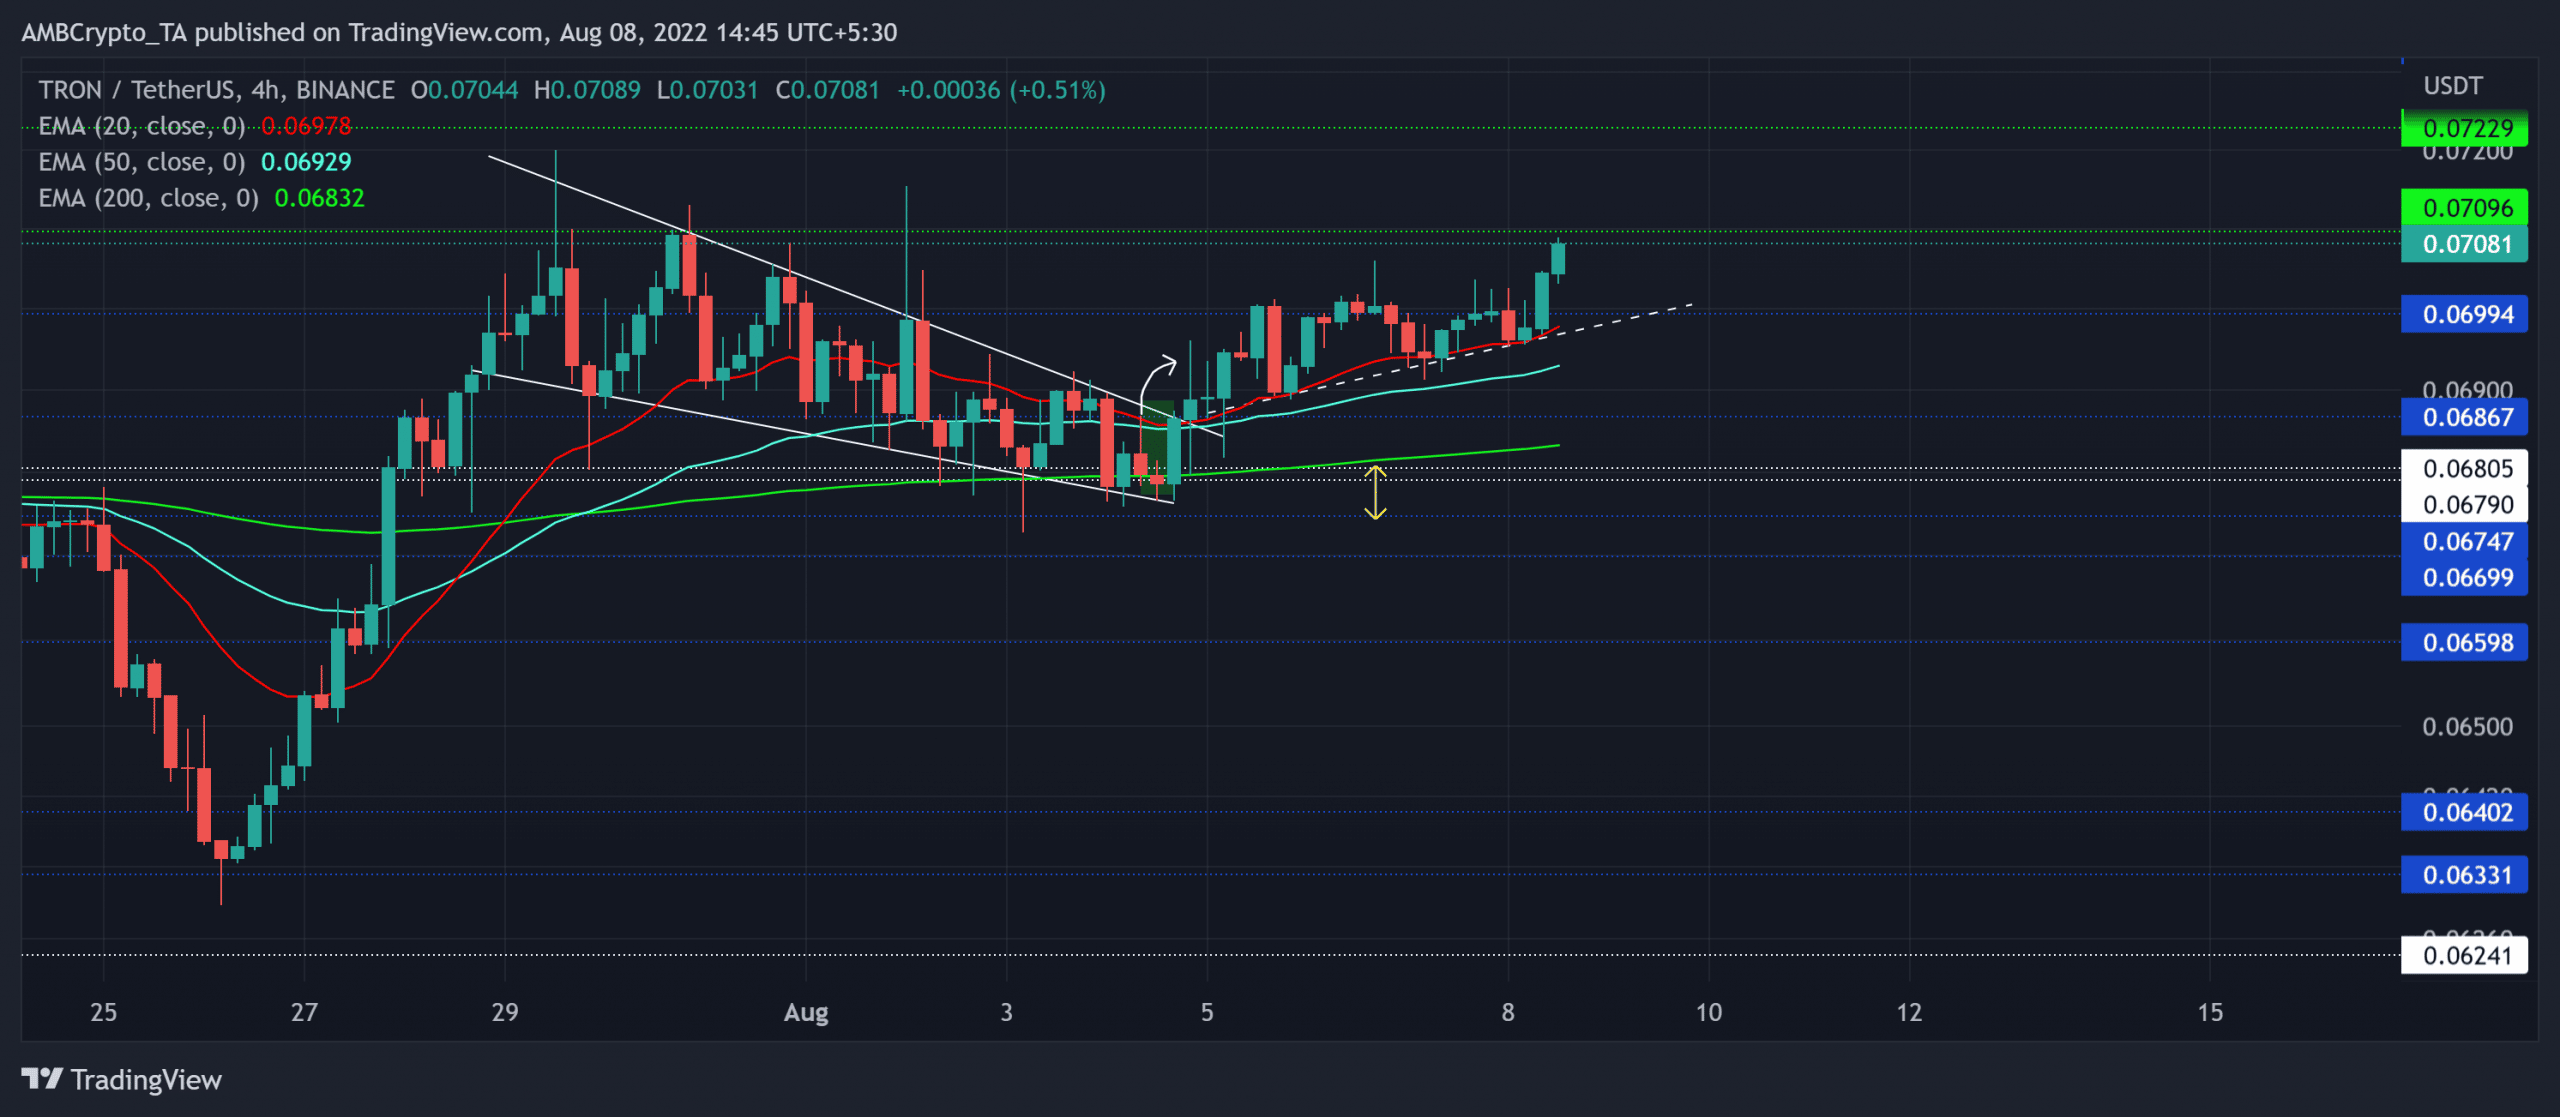
For over a month, Tron [TRX] has been relying on the $0.062-level for its support while aiming to snap the $0.0709-level. Recently, a breakout from the bullish pattern positioned the coin to an expected upside.
As a result, the altcoin was on its way up to retest the $0.0709-$0.072 range in the coming sessions. A potential reversal could be lurking around the corner should the bulls fail to ramp up the declining volume trend.
A jump above the 20/50 EMA reinforced the chances of sustained near-term recovery. At press time, TRX was trading at $0.07081, up by 1.8% in the last 24 hours.
TRX 4-hour Chart
TRX saw significant growth after rebounding from the $0.063-level. The revival from this long-term support laid the foundation for a classic bullish pennant on the 4-hour chart.
The 200 EMA (green) supported the pennant’s short-term decline and propelled morning star candlesticks that aided TRX in breaking out of the bullish pattern.
With the 20 EMA (red) still looking north, an extended bull run could test the $0.0709-$0.072 range. For nearly two months, the sellers have shown tendencies to recoup in the previously mentioned range. Thus, traders/investors should look for rebounding signals from this zone.
In such a case, the trendline support (white, dashed) near the 20 EMA around the $0.069-mark could cushion retracements.
Rationale
The Relative Strength Index (RSI) jumped above the 61-level while projecting a clear bullish edge. The buyers should look for a potential reversal from the overbought region before taking a short position.
Furthermore, the Volume Oscillator (VO) marked lower troughs during the breakout rally and confirmed a bearish divergence with price. This kept the chances of a near-term reversal bright.
Also, the CMF noted lower troughs and bearishly diverged with the price. The CMF’s close below the zero-mark would further hint at the ease in buying edge.
Conclusion
The bullish pennant breakout was gliding towards the two-month resistance in the $0.0709-$0.072 range, at the time of writing. Also, given the bearish divergences in the VO and CMF, TRX could see a short-term setback before picking itself up to continue the buying spree. The targets would remain the same as above.
However, investors/traders should consider Bitcoin’s movement and its impact on broader market perception to make a profitable move.


