Cardano: A tale of two breakouts, but which is more likely

Disclaimer: The findings of the following analysis are the sole opinions of the writer and should not be taken as investment advice
As the dust settled in the Cardano market, the price began to take shape within a symmetrical triangle. The end of the consolidation phase would result in a sharp swing, but the direction is still unclear.
The following article explains two possible breakouts that might be possible and certain conditions that need to be met for each outcome. At the time of writing, ADA was valued at $2.46 with a market cap of $78.8 Billion.
Cardano 4-hour Chart
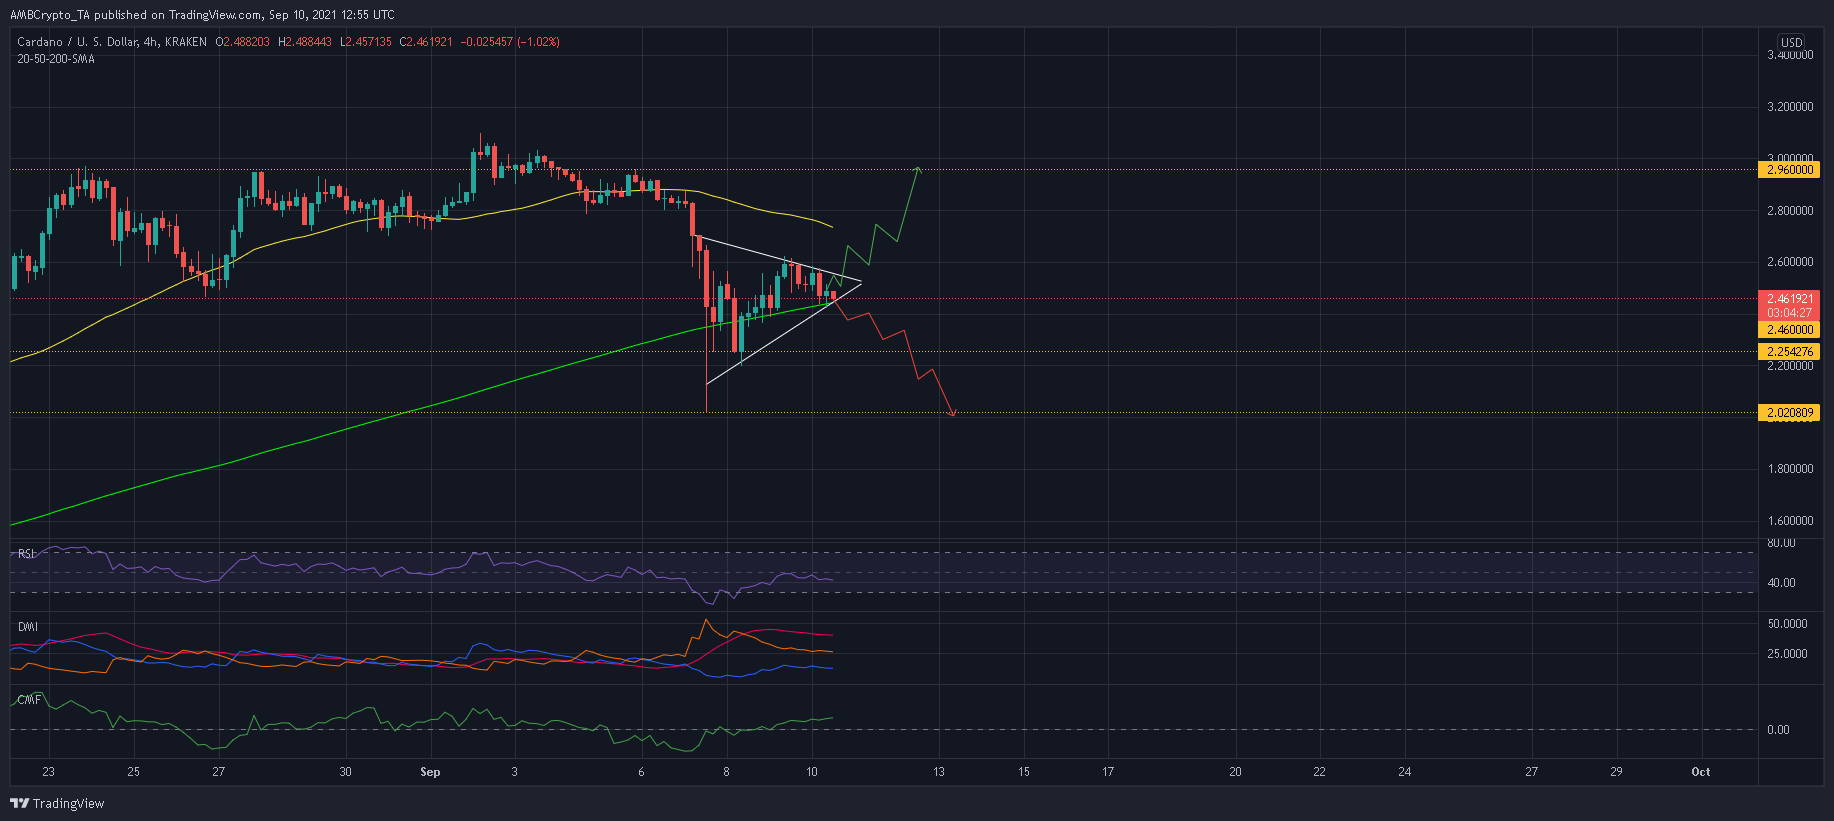
After bouncing back from $2.25, ADA formed a symmetrical triangle on its 4-hour chart. Now there are two possibilities going forward. If the pattern functions as a continuation of the previous downtrend, a breakdown is likely. A bearish outcome would put ADA back near the $2-mark – Another 17% drop from its press time level.
To confirm this outcome, sellers would need to enforce a close below the 200-SMA (green) and 8 September’s swing low of $2.25.
On the other hand, there are chances that the symmetrical triangle will function as a reversal pattern. In this outcome, an upwards breakout would position ADA between $2.95-$2.96. A close above $2.62 and the 50-SMA (yellow) would heighten the probability of this upswing.
However, it’s important to note that a period of consolidation is likely before a breakout is seen. Volatility has been gradually receding too as key indicators inched towards equilibrium levels.
Reasoning
The 4-hour RSI was denied a break above its half-line and inched lower as bears prevented further upside. The same was confirmed by the Directional Movement Index’s trajectory. The -DI moved parallel with the +DI line and suggested that a bearish trend is still active.
On a positive note, capital inflows were healthy as the Chaikin Money Flow gradually shifted to higher levels. These inflows could act as a fail-safe against an extended market decline.
Conclusion
The latest crypto sell-off triggered a state of confusion in the ADA market. While a symmetrical triangle pattern did emerge on the charts, the direction of the breakout is unclear.
The indicators, at press time, were more inclined towards a bearish outcome. However, there seemed to be valid arguments on either side. Hence, a safer bet would be to wait for ADA to touch the aforementioned levels before taking a long or short call.