Cardano [ADA]: Latest rally causes altcoin to trade at pre-FTX collapse level
![Cardano [ADA]: Latest rally causes altcoin to trade at pre-FTX collapse level](https://ambcrypto.com/wp-content/uploads/2023/01/kanchanara-RqorX1pfF7k-unsplash-1.jpg)
- ADA’s price has returned to its pre-FTX collapse level.
- Coin accumulation has rallied significantly in the last three weeks.
According to data from CoinMarketCap, leading layer 1 coin Cardano [ADA] traded at the $0.36 price level during the intraday trading session on 21 January, marking the first time the coin has reached this level since the fallout of FTX.
ADA, like the rest of the general cryptocurrency market, suffered a significant decline in value following the unexpected collapse of the cryptocurrency exchange FTX in early November 2022. ADA closed the 2022 trading year at $0.24, having declined by 33% since FTX collapsed.
Read Cardano’s [ADA] Price Prediction 2023-24
Can this rally be sustained?
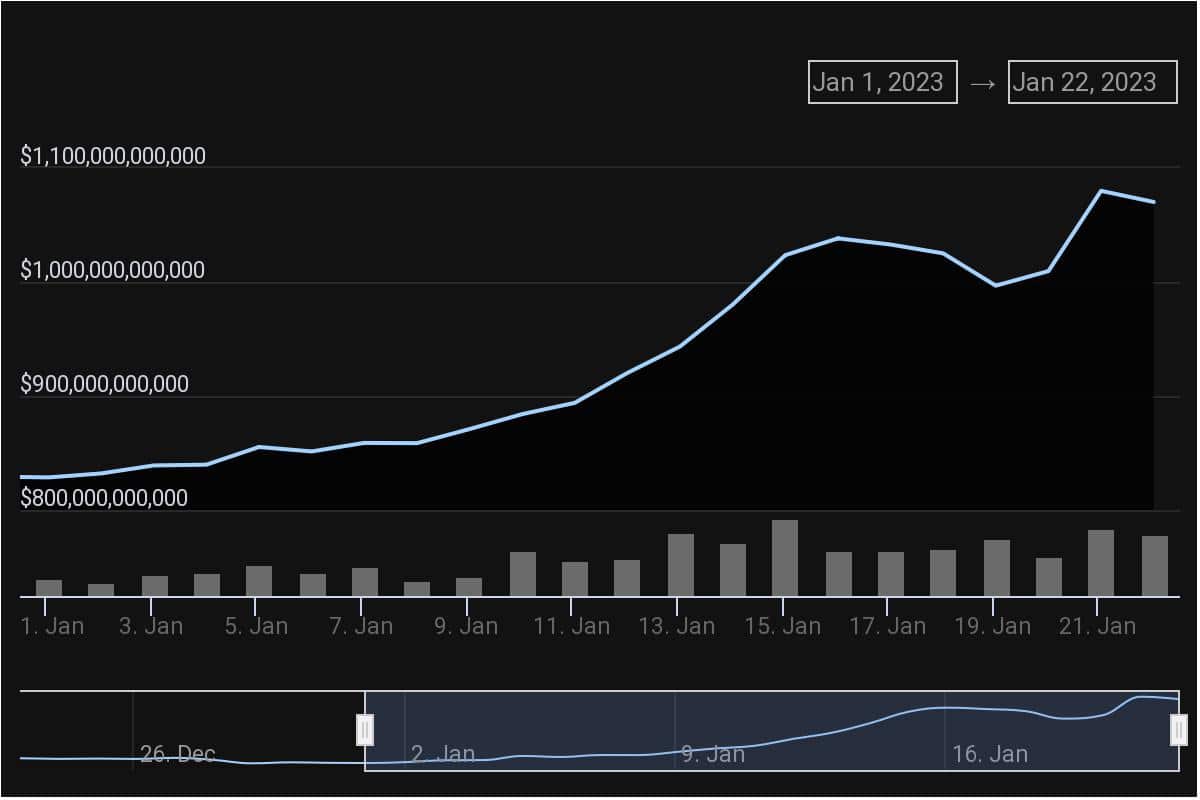
According to data from CoinGecko, the global cryptocurrency market capitalization has gone up by 21% since the beginning of the year. Sharing a statistically significant positive correlation with Bitcoin [BTC], whose price has risen astronomically since the year started, ADA’s value has also increased by 44%.
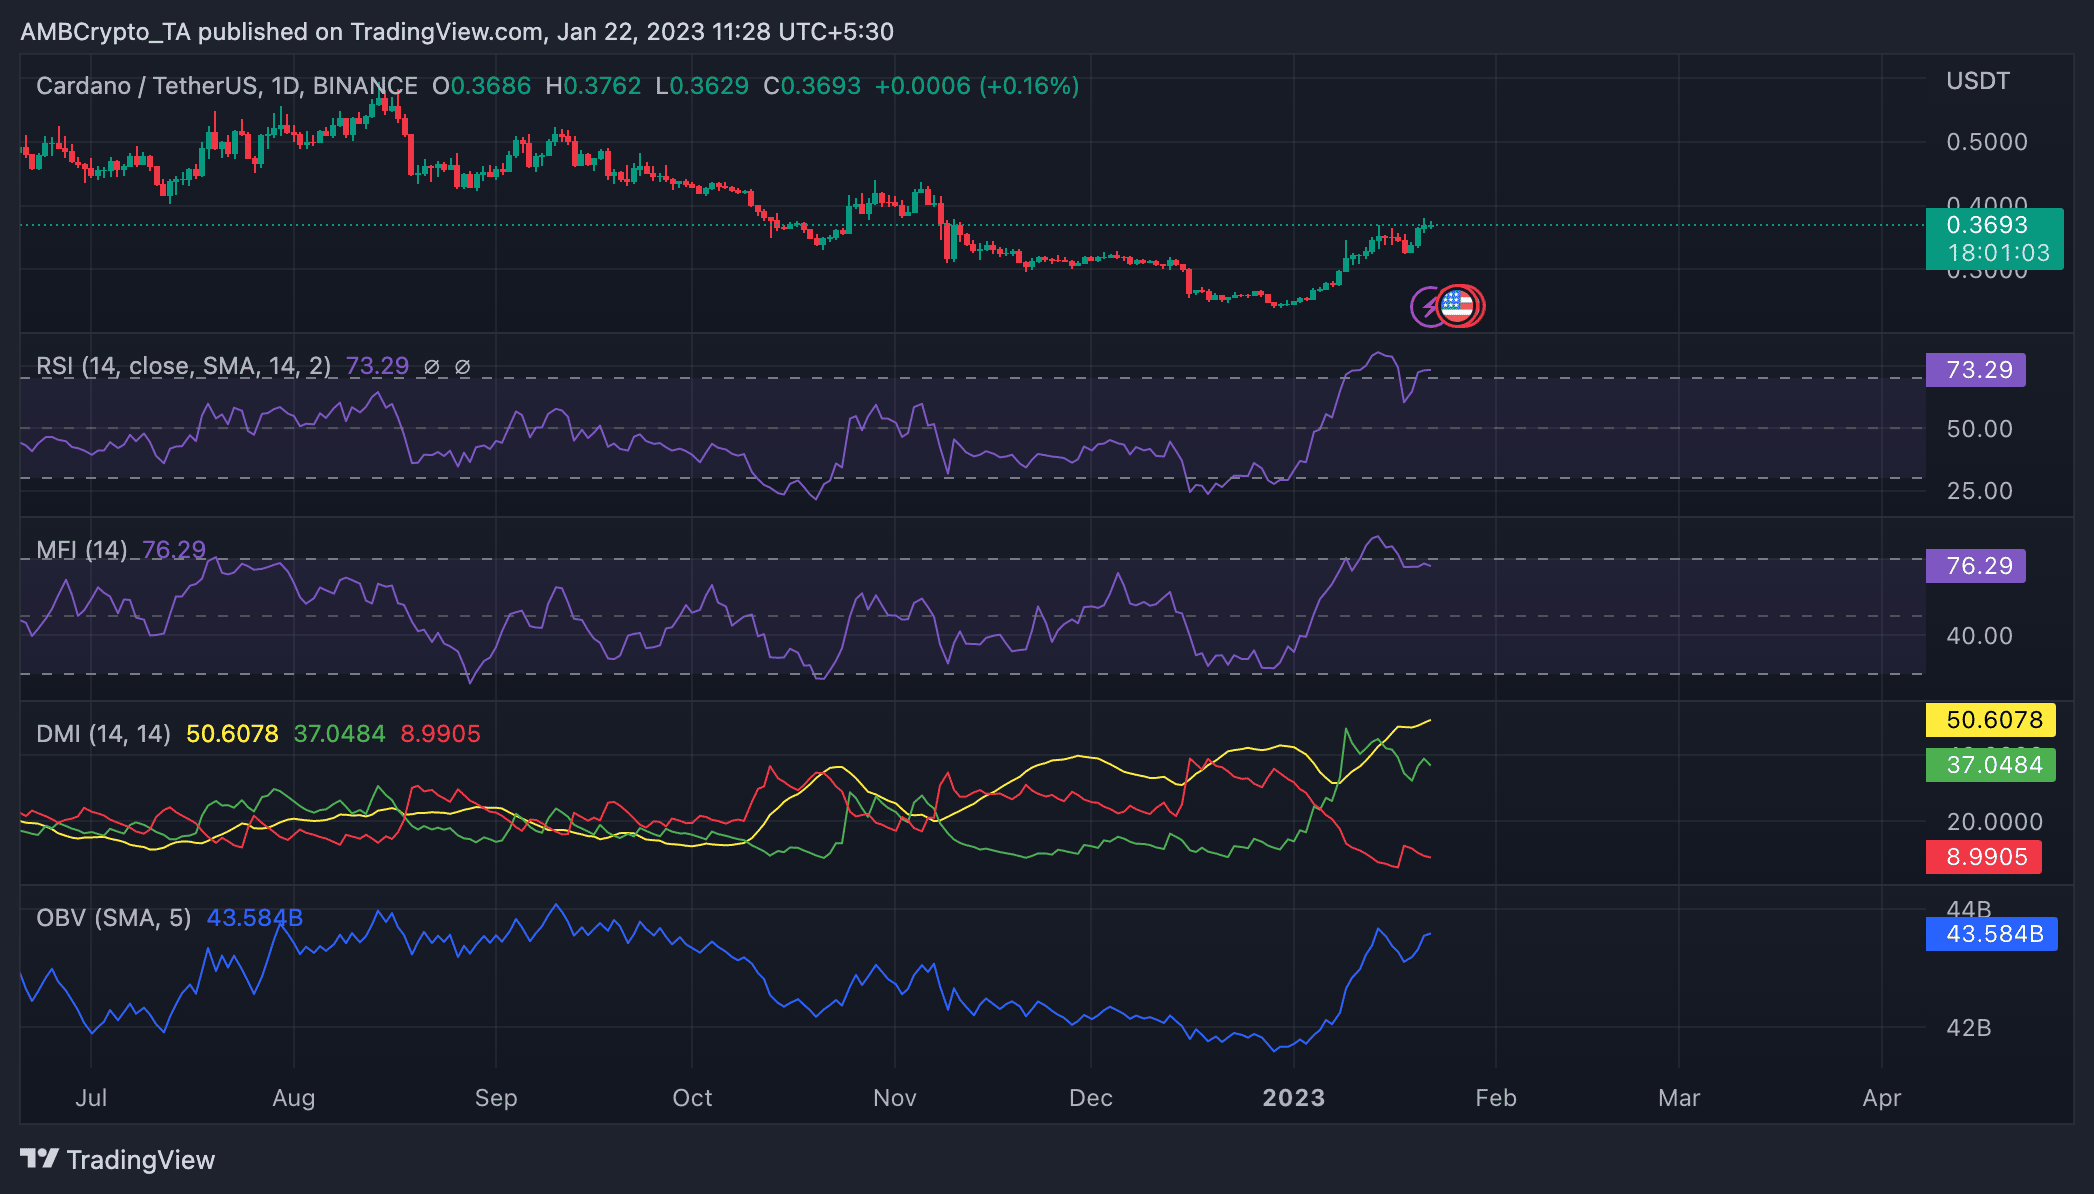
At its current price, ADA was overbought on the daily chart. Momentum indicators have been on an upward trend since the year began to be pegged at overbought highs at the time of writing.
The coin’s Relative Strength Index (RSI) lay at 73.29, while its Money Flow Index (MFI) was spotted at 76.29. The gradual spike in these indicators revealed that ADA had seen increased accumulation since the 2023 trading year commenced.
Are your ADA holdings flashing green? Check the profit calculator
Likewise, the asset’s On-balance volume (OBV) was in an uptrend at 43.517 billion, having gone up by 5% since the year started.
When an asset’s OBV increases, it suggests that buying pressure is more significant than selling pressure. It also means that more volume is associated with rising prices, indicating that buyers are more aggressive than sellers and that the asset’s price is likely to continue growing.
Further, increased ADA accumulation in the last 21 days put buyers in control of the daily market. The position of the alt’s Directional Movement Index confirmed this.
The directional index is made up of the positive directional indicator (+DI), the negative directional indicator (-DI), and the average directional index (ADX). When +DI (green) is above -DI (red) and Average Directional Index (ADX) is rising, it suggests that an uptrend is strong and likely to continue. This observation is similar to the current market situation with ADA.
At press time, ADA’s ADX (yellow) was positioned at 50. With the market significantly bullish in its aptitude, an ADX reading above 50 indicated a strong bullish trend, which might go on for a few more days before a price reversal is initiated.