Cardano long-term investors can wait to buy strength here

Disclaimer: The findings of the following analysis are the sole opinions of the writer and should not be considered investment advice.
Cardano has been in a steady downtrend since April. Going further back, Cardano reached its apex in September of 2021, when the coin hit its all-time high (ATH) of $3.1.
In the past couple of months, there has been evidence of rising buying volume. This could signal the formation of a bottom for an asset on the price charts. Should long-term Cardano bulls get excited by this finding?
ADA- 1-Day Chart
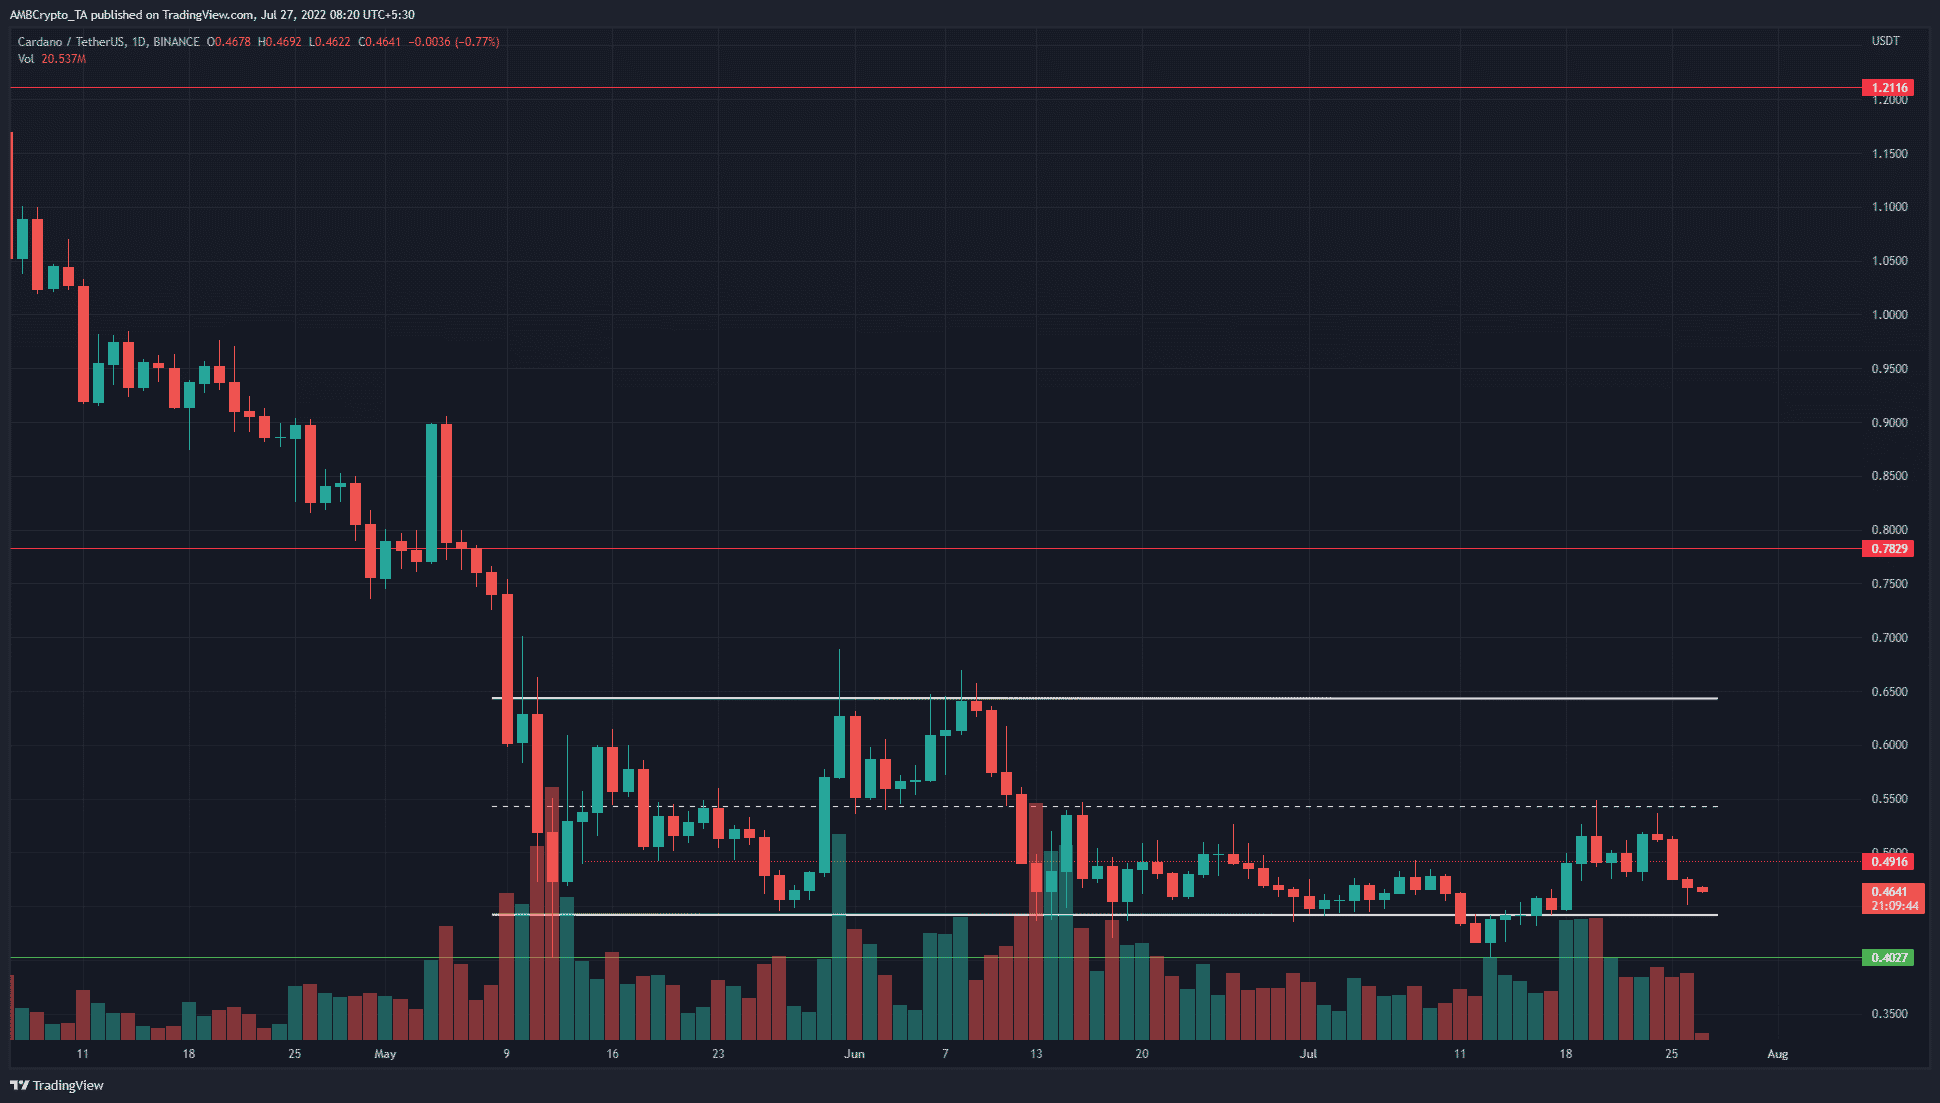
In May and June, ADA formed a range from $0.44 to $0.64, shown in white. Early June saw Cardano rejected at the range highs. Mid-July saw a drop beneath the range low to test the horizontal $0.4 support and a quick bounce to $0.55.
However, through the past two months, the mid-point of the range had acted as a stiff resistance. It did so once more over the past two weeks. Despite the best efforts of the bulls, they were unable to close a daily trading session above the $0.52 mark, which highlighted the number of sell orders in the vicinity of $0.55.
At the time of writing, ADA looked set to move to $0.44 and likely lower as well. The technical indicators showed bearish momentum, but also the presence of some buying volume in the past few months. Yet, based on the price action, a reversal was not yet likely.
Rationale
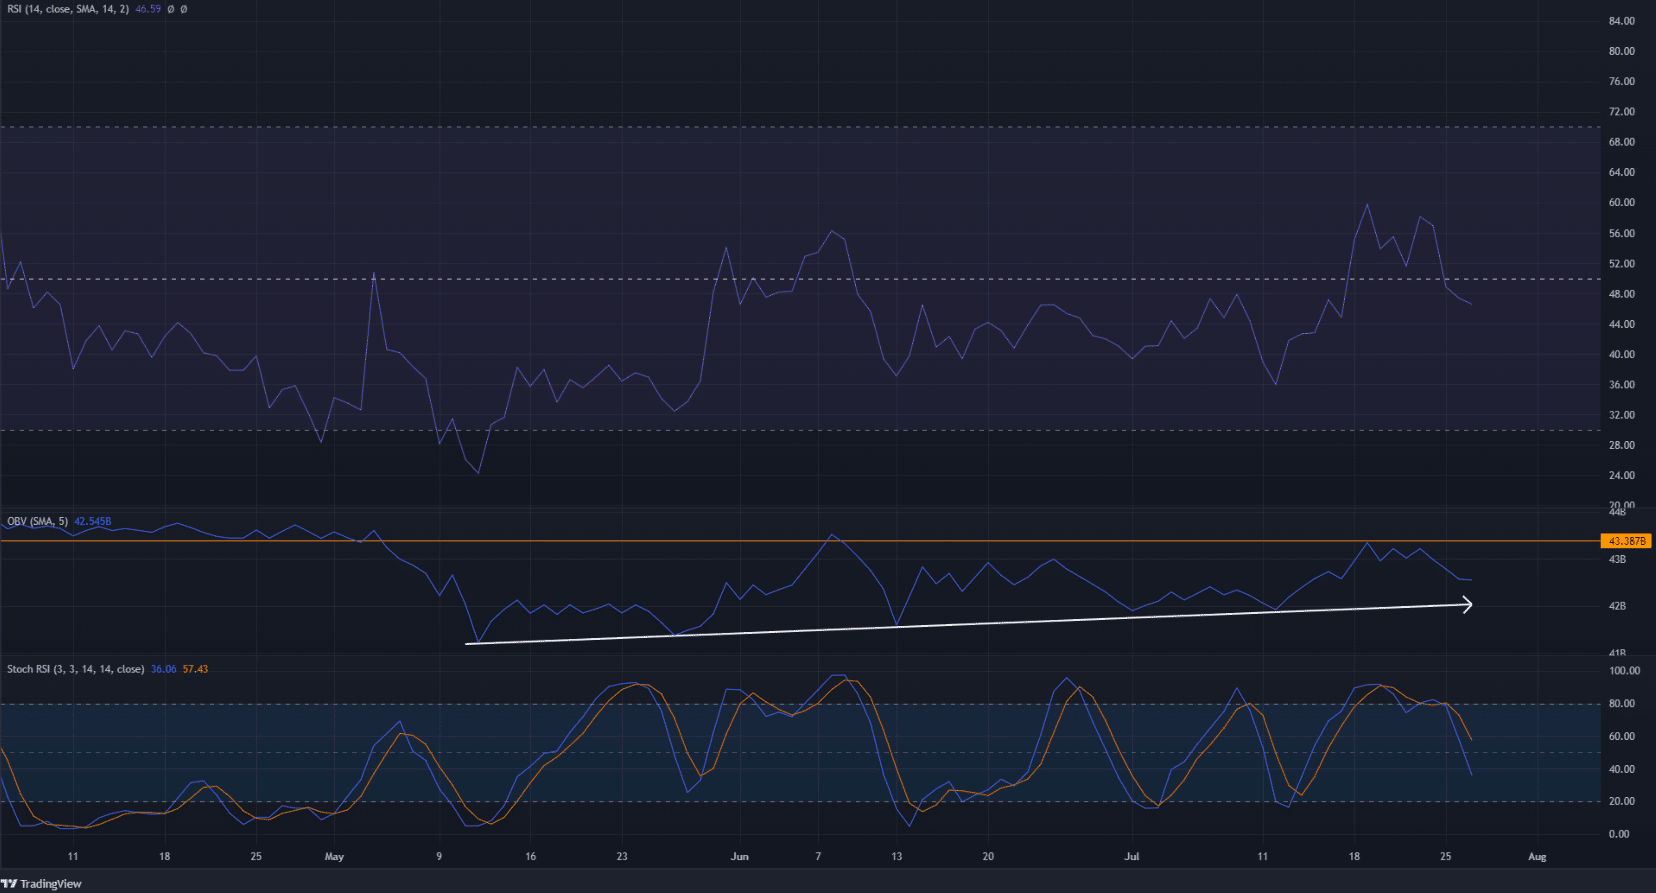
The RSI on the daily chart climbed above neutral 50 for the space of two weeks, rising as high as 60. The bulls tried their utmost to shift the trend in their favor, but the $0.55 bearish bastion was simply too strong. The Stochastic RSI also formed a bearish crossover recently and dove lower.
The OBV faced resistance at a level marked in orange, a level which served as support in April. In the past couple of weeks, the OBV faced rejection from this level.
Yet, since May, the OBV formed higher lows. This suggested buying volume has been on the rise and hinted at the possibility of an accumulation phase for Cardano within the range.
Conclusion
The rising OBV alone does not merit the expectation of a trend reversal. The presence of heavy buying over the past two months need not spur a huge rally to $0.55 or even above it.
Bitcoin faced selling pressure on the charts as well, and any losses BTC sees can see Cardano dump lower as well. Caution was advisable and long-term investors can wait to buy strength rather than weakness.