Cardano [ADA] retests $0.35 support area, but indicators favor bears

Disclaimer: The information presented does not constitute financial, investment, trading, or other types of advice and is solely the writer’s opinion.
- The market structure on the daily chart remained bullish.
- The shift in momentum indicators showed weakness from buyers.
Cardano [ADA] showed some bullish strength on the charts in mid-February. The retest of the $0.345 level saw a strong bounce in prices on 14 February, but the sellers held firm at the $0.42 area and forced a rejection.
Read Cardano’s [ADA] Price Prediction 2023-24
The on-chain metrics showed user numbers were declining throughout February. This could catch up with the price action, which was on the verge of shifting toward a bearish bias.
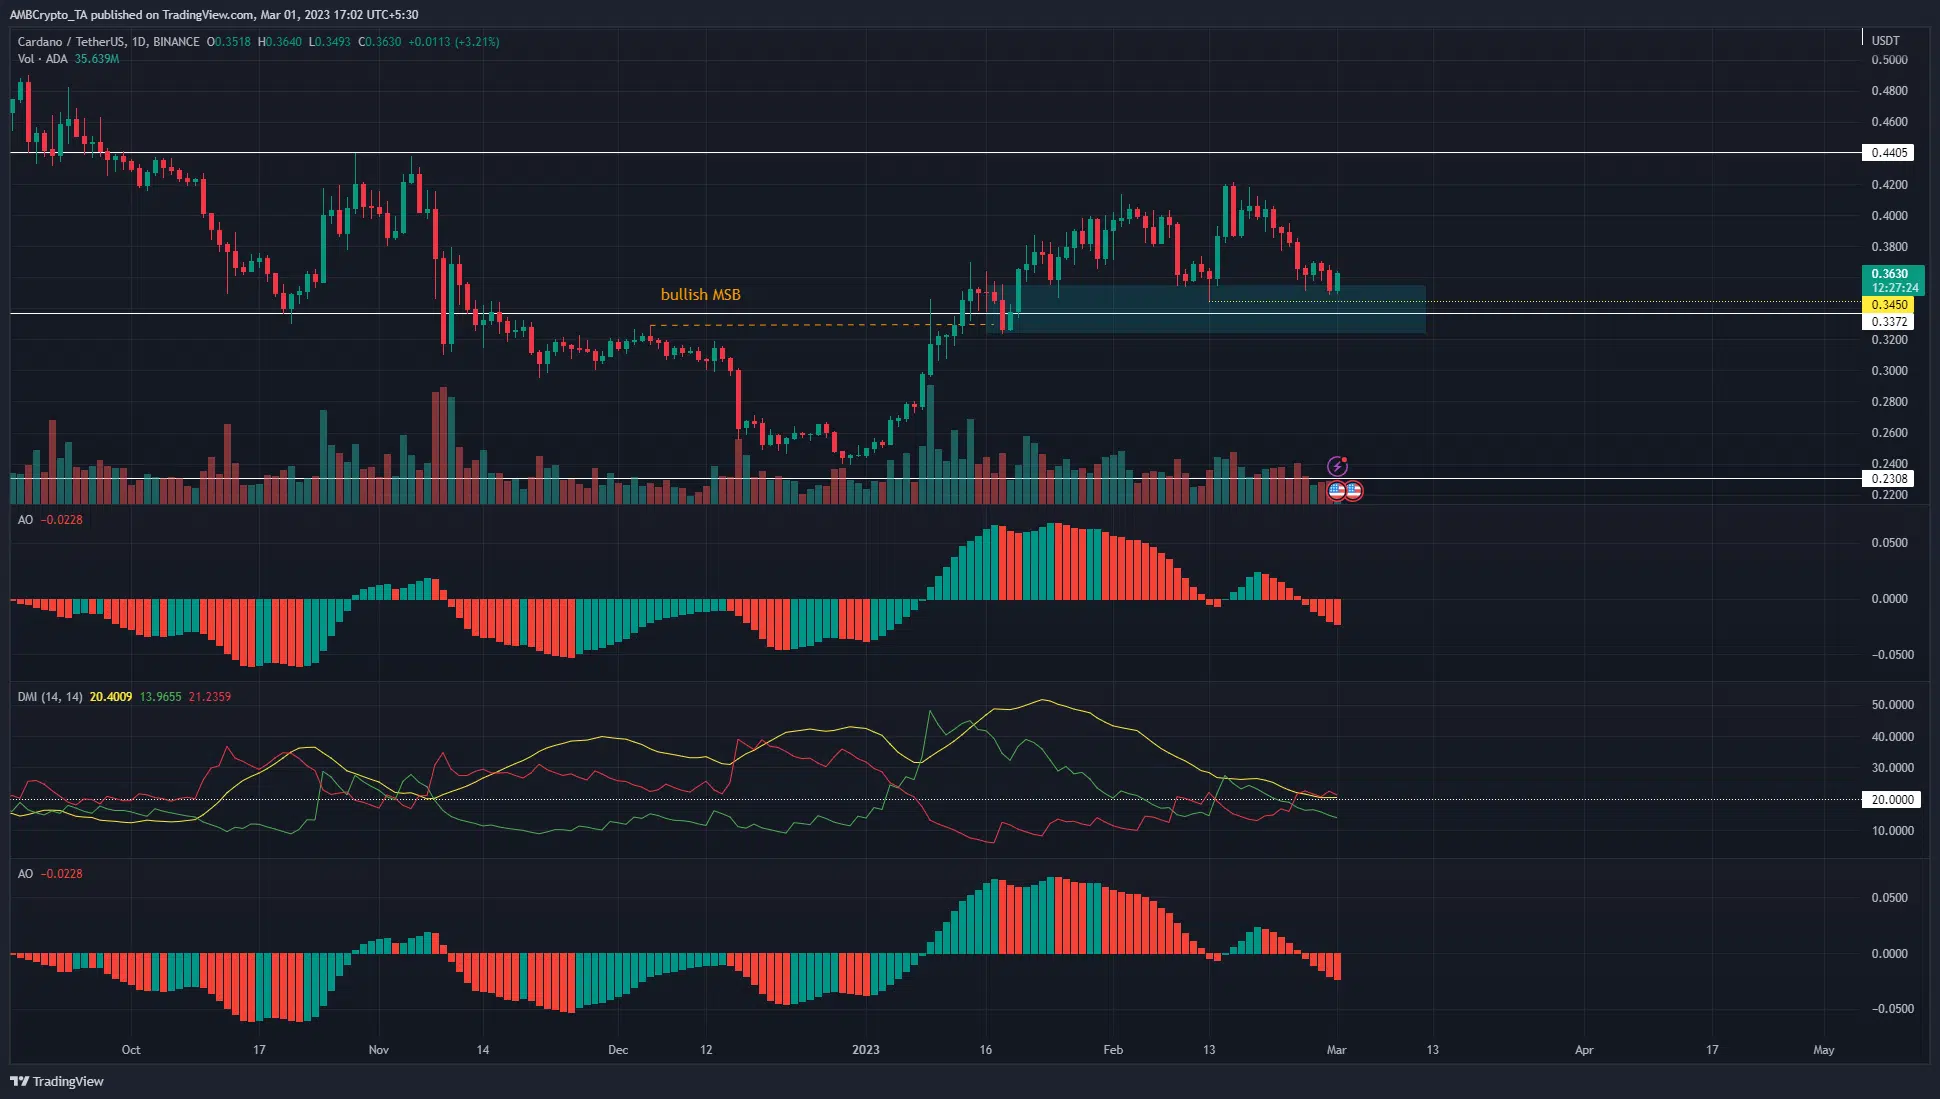
The first test of an order block saw a bullish reaction, but momentum has weakened
The Awesome Oscillator formed a bearish crossover beneath the zero line, indicating strong bearish momentum. However, the 50 and 100-period moving averages showed the trend remained bullish. From the perspective of price action, ADA teetered on the verge of forming a lower low.
In January, the price broke the previous lower high and flipped the structure to bullish. Inasmuch, on 17 January, a bullish order block formed at $0.35 on a minor dip and the prices shot upward to reach $0.4.
The rejection at $0.42 in mid-February saw Cardano drop back to $0.35. The first retest of the order block is usually the strongest, but the ones thereafter can be more uncertain. At press time, ADA tested this region for the third time since 25 January.
The DMI showed a strong bearish trend in progress, but just barely so. The ADX (yellow) and -DI (red) were above 20, with the -DI having climbed above this level very recently.
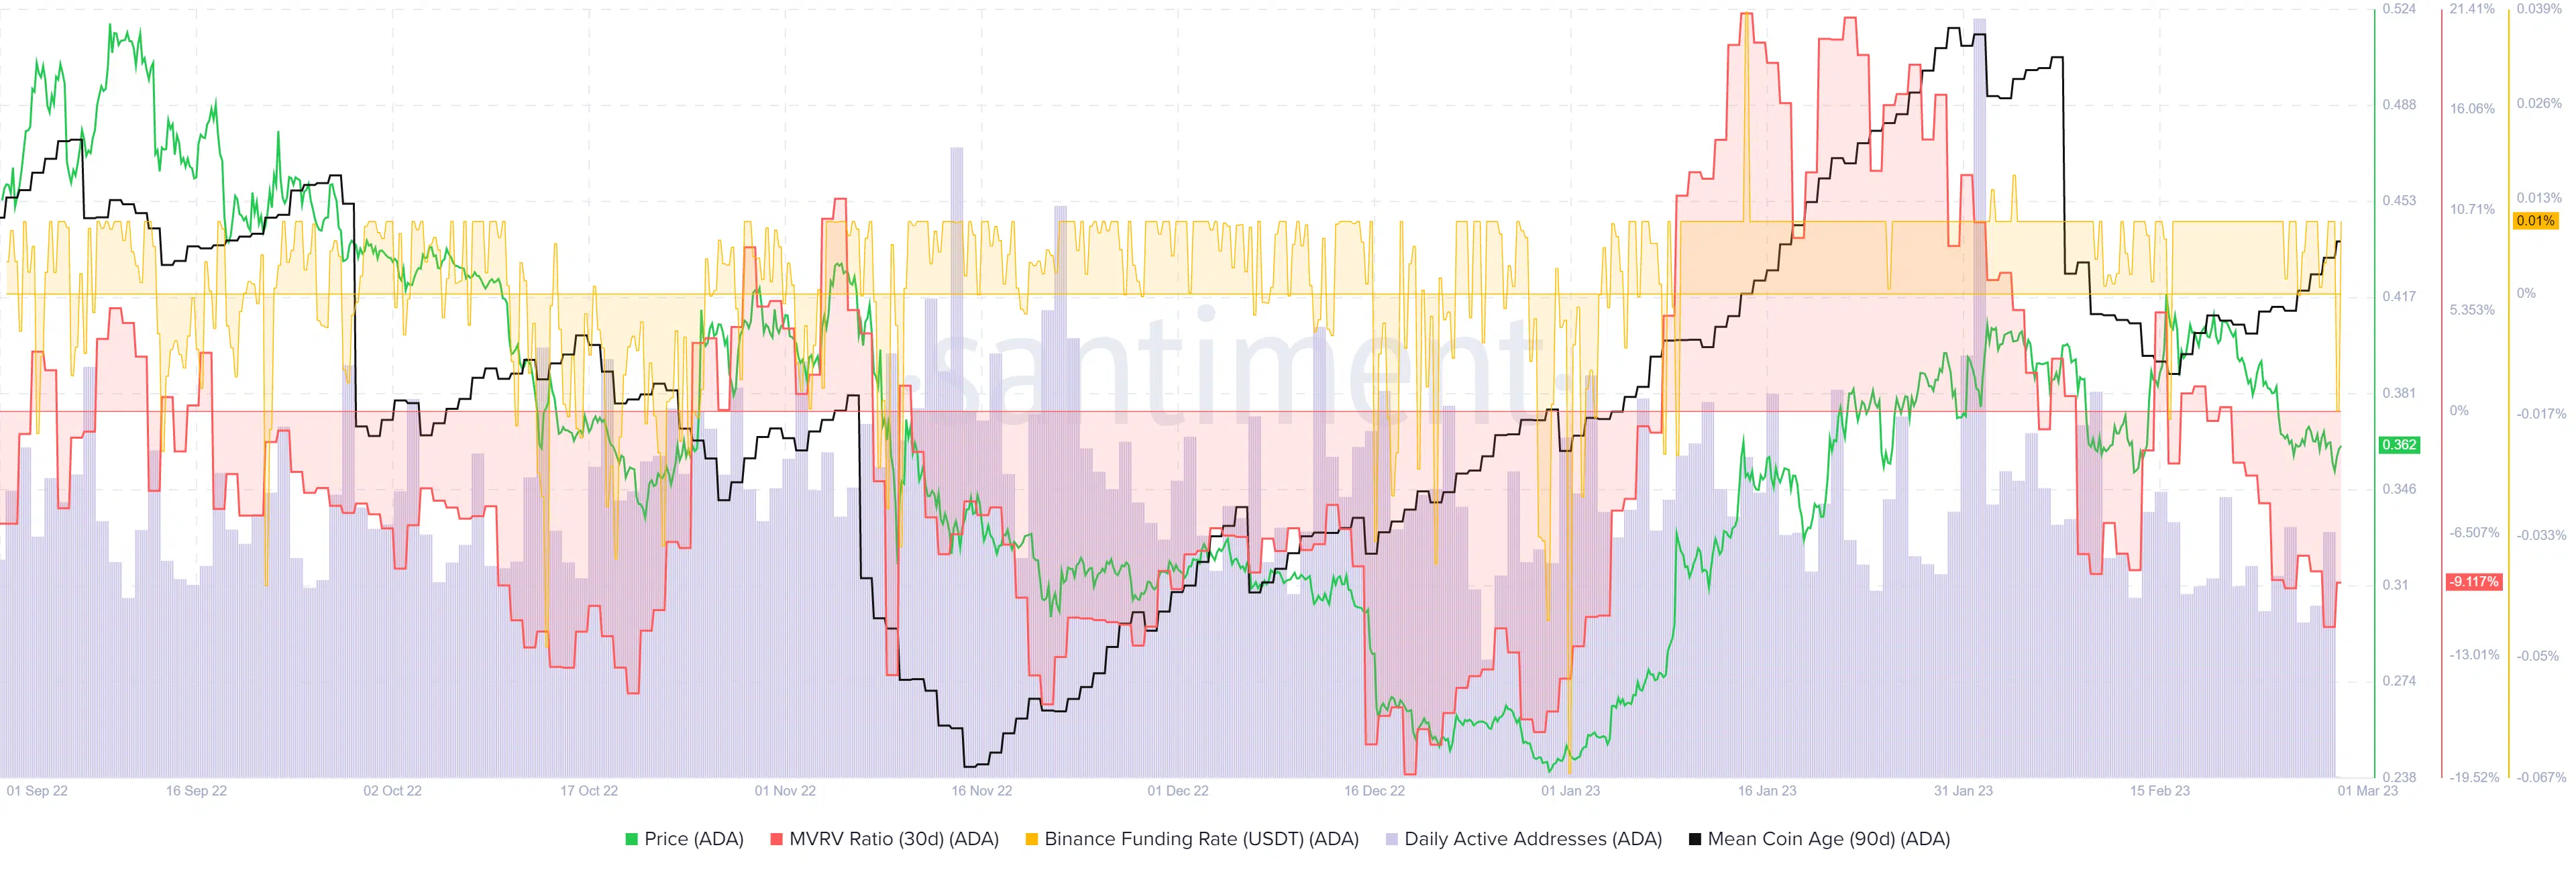
Active daily addresses count was in a decline

Source: Santiment
The decline in the active addresses began after the large spike on 31 January. Since then, the metric has made a series of lower highs. Meanwhile, the 30-day MVRV ratio was also deeply in the negative zone. This indicated that holders were at a loss.
Is your portfolio green? Check the Cardano Profit Calculator
The 90-day mean coin age saw a very minor slump when Cardano faced a rejection at $0.42. In the past two weeks, the metric has climbed higher, which suggested addresses could be accumulating the asset. The funding rate also recovered after a sharp drop. Despite the retest of the strong support zone, buyers must remain cautious.
A daily session close below $0.345 will flip the daily timeframe bias to bearish.


